Alien Weather Goes 3D: JWST maps launch off-world-climate science
The James Webb Space Telescope has produced the first 3D weather map of an exoplanet, revealing a blazing hotspot, a cooler ring, and chemistry that changes with altitude and longitude on WASP-18b. Here is how eclipse mapping works and why it will reshape Roman and ELT target lists.
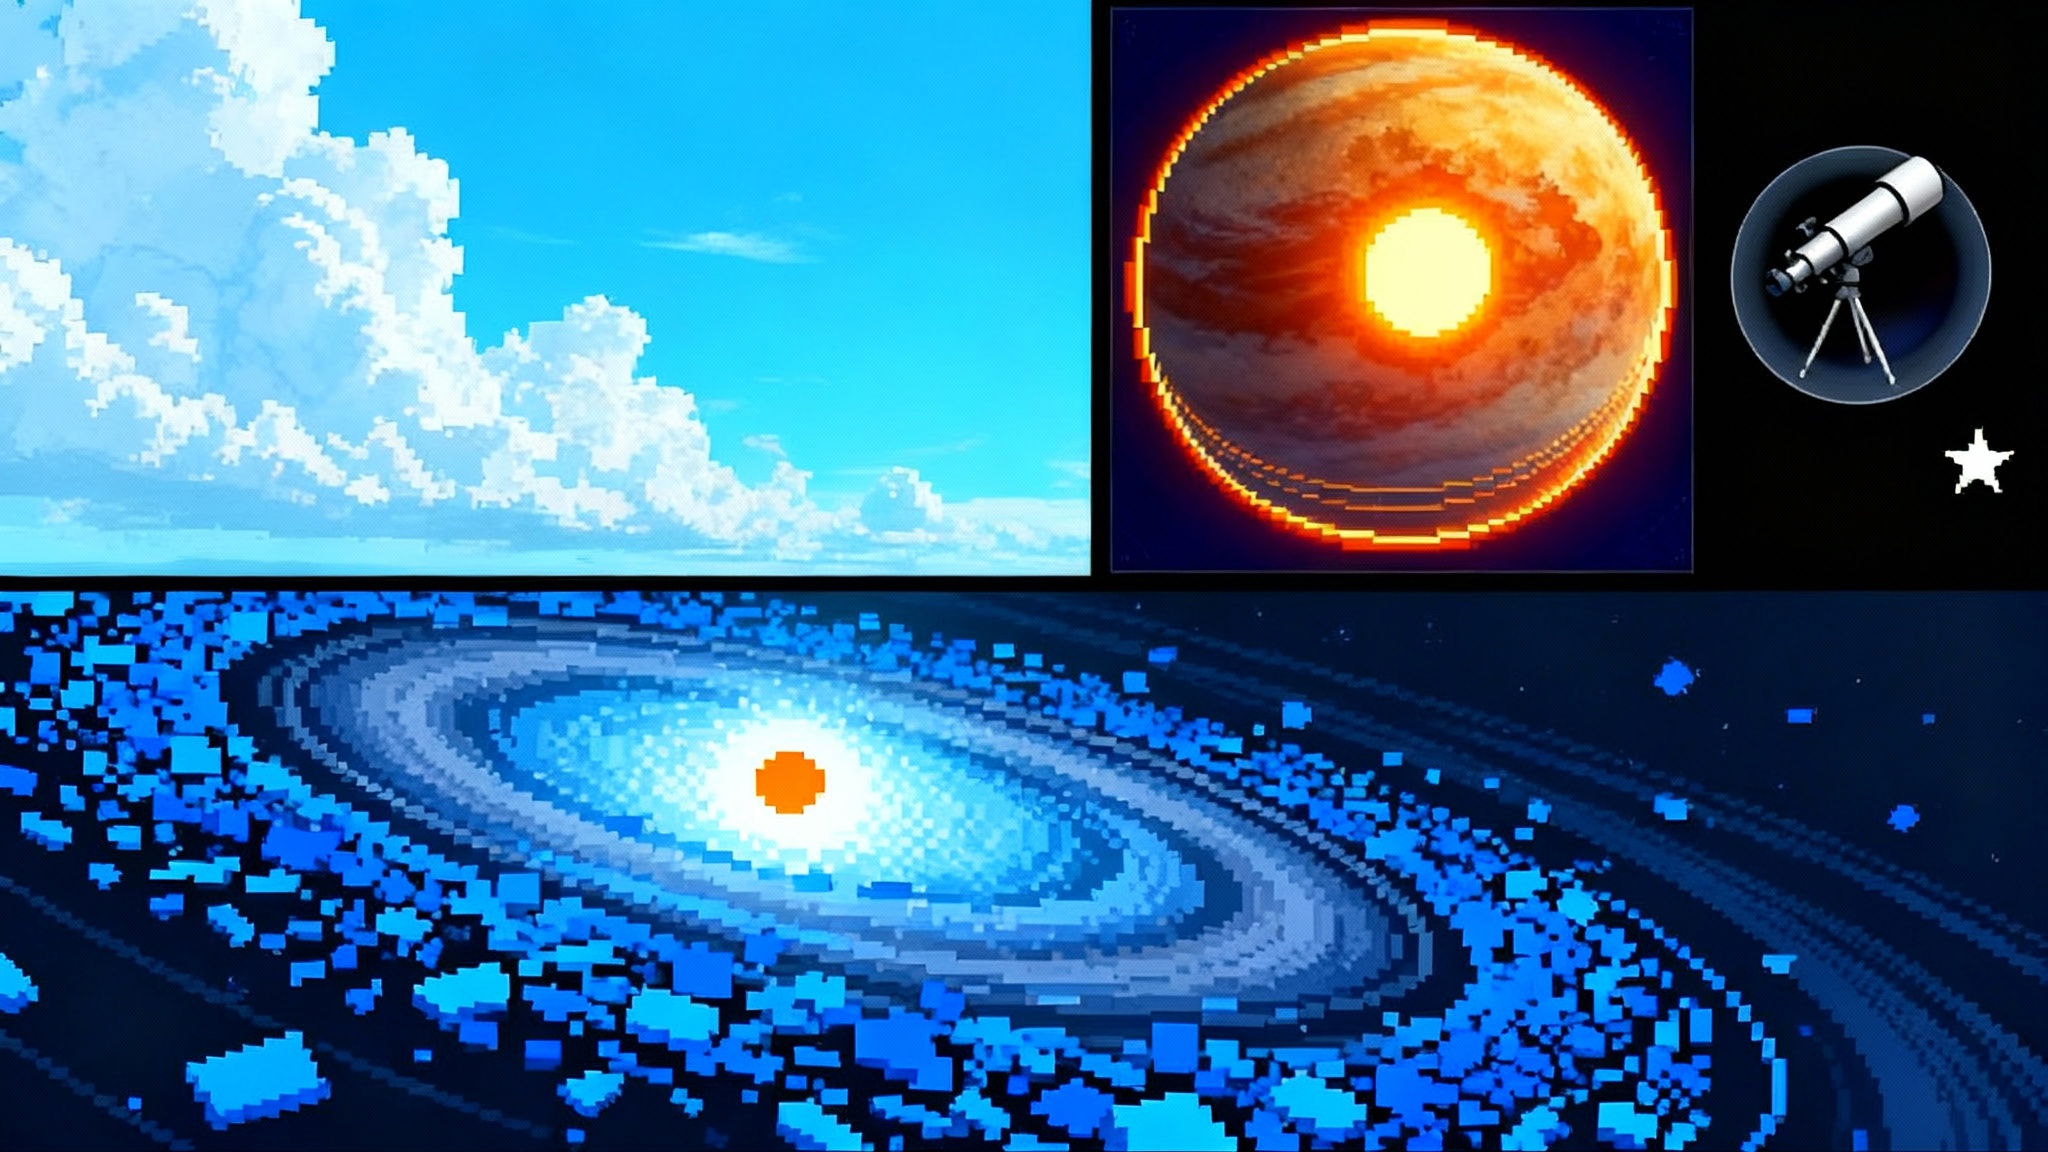
Breaking: the first 3D weather map of another world
Last week a team working with the James Webb Space Telescope unveiled something planetary scientists have chased for decades: a full three dimensional map of an exoplanet’s atmosphere. The target was WASP‑18b, an ultra hot Jupiter about 400 light years away. By watching the planet slip behind its star and analyzing how the light faded at many different colors, the team reconstructed temperature across latitude, longitude, and altitude. Their study in late October 2025 reports a bright central hotspot, a cooler surrounding ring, and signs that water molecules near the hottest region are breaking apart into hydrogen and oxygen before recombining farther out. You can read the primary result in the peer reviewed Nature Astronomy result.
If the first generation of exoplanet science was about discovering worlds, this is the moment when characterization gets cinematic. We are no longer looking at a single blurry dot or a one dimensional spectrum. We can now talk about fronts, jets, and temperature inversions on a world that orbits its star in just 23 hours. That is alien weather, mapped.
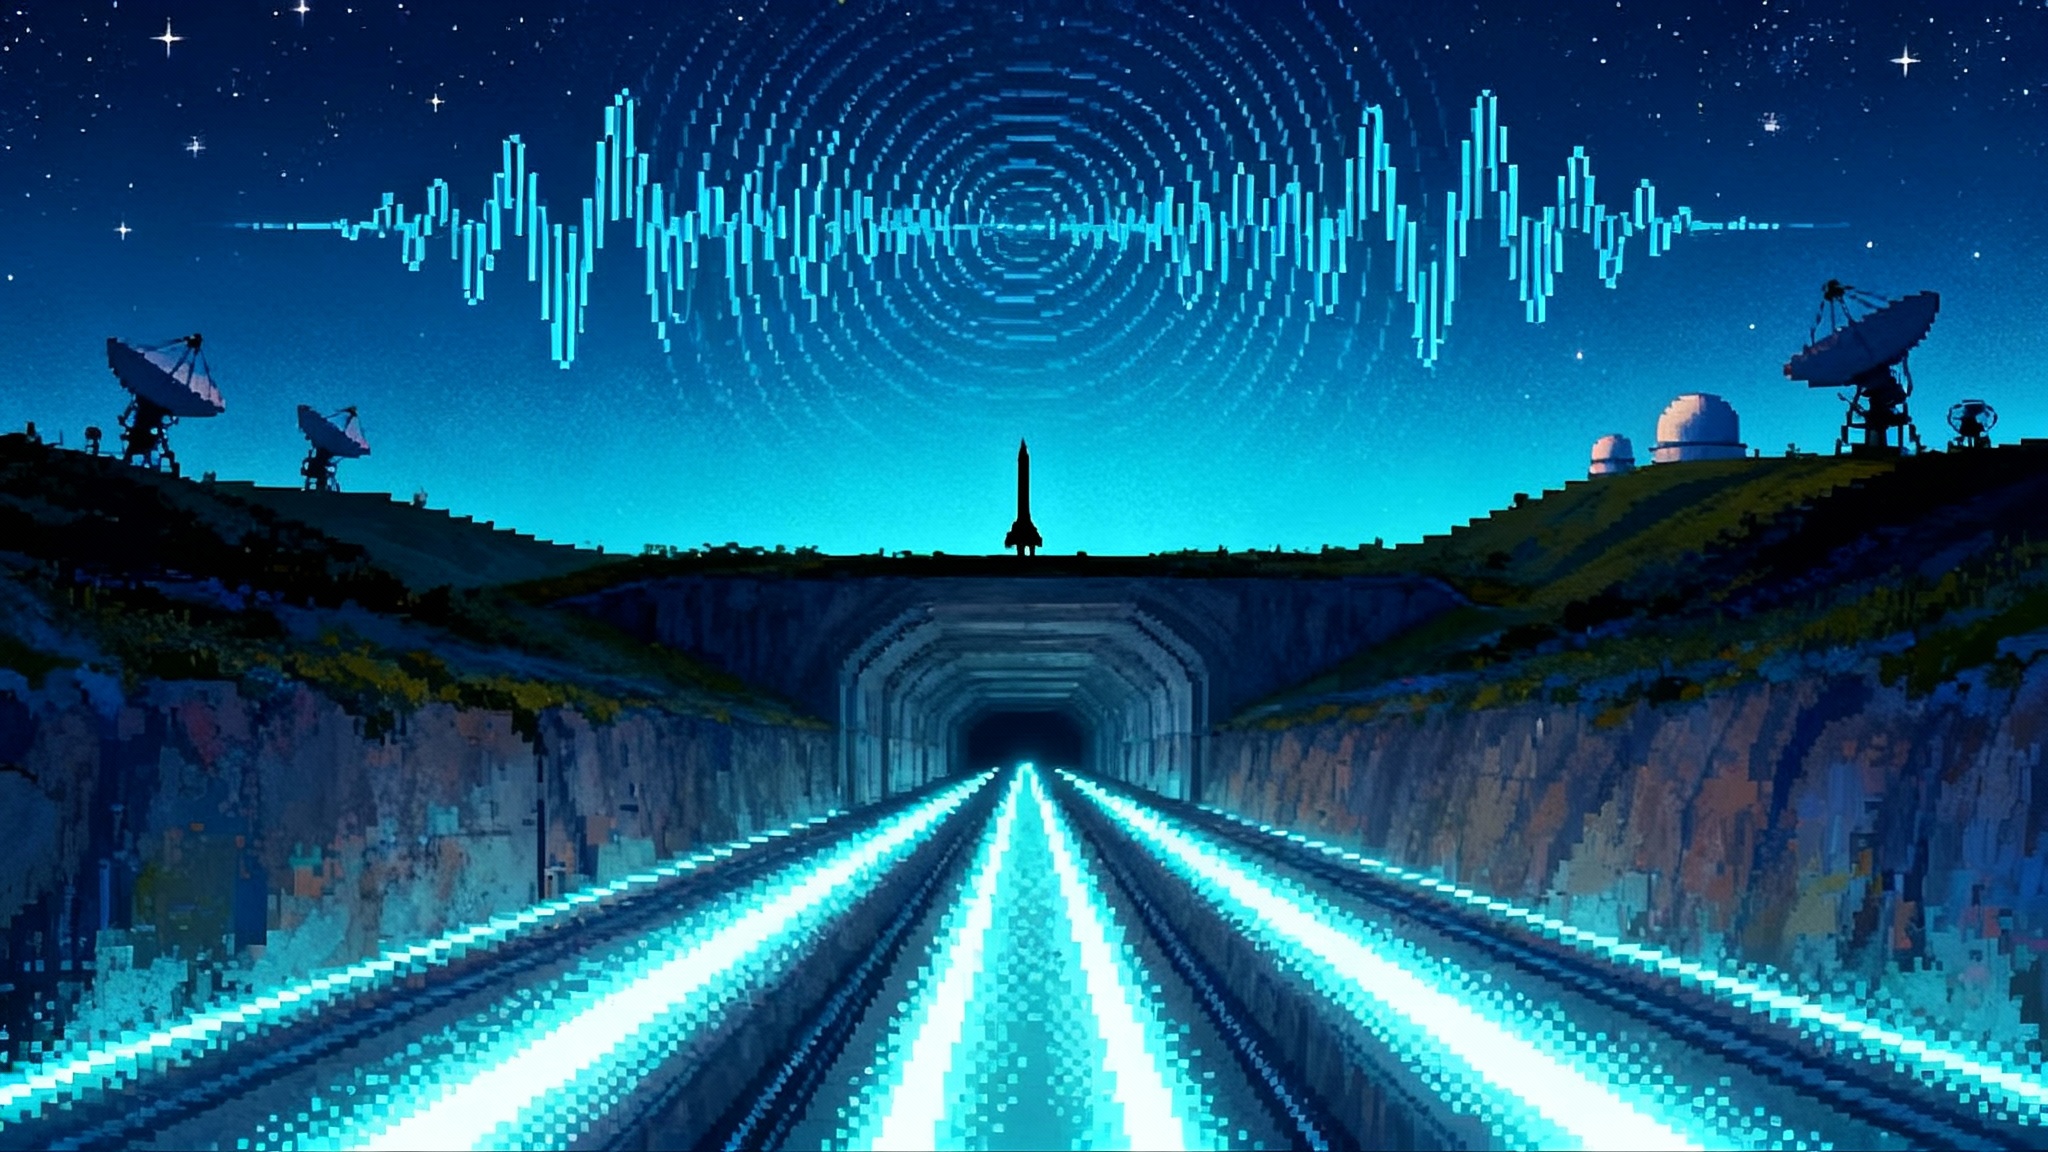
Eclipse mapping, explained with a household dimmer
Imagine a theater stage with a single spotlight. The set is a painted globe that rotates slowly. Now slide a black panel across the stage and back again, like a curtain that hides the globe piece by piece. If you record how the brightness changes as specific patches vanish and reappear, you can repaint the globe. That is eclipse mapping in spirit. The star is the spotlight, the planet is the set, and the eclipse is the curtain.
For a solar system analog, see how precision occultations and artificial eclipses of the Sun reveal fine structure close to bright sources.
Two tricks turn this into a 3D tool. First, ingress and egress, those short moments when the planet is partly obscured, contain the geometry that tells you whether a bright patch sits near the equator or closer to the limb. Second, spectroscopy slices the atmosphere by altitude. Some wavelengths are absorbed by water vapor, carbon monoxide, or other molecules high in the atmosphere. Other wavelengths pass through to deeper, hotter layers. By measuring the eclipse at many wavelengths at once, JWST separates the layers like a tomographic scan.
The result for WASP‑18b is not just a map that says the center is hot and the edges are cool. It is a layered atlas that shows a temperature inversion over the hotspot and a cooler ring with different chemistry near the planetary limbs. This is the kind of structure that global circulation models predicted in broad strokes. Now we can test those predictions directly.
Why a 3D map matters more than a beautiful picture
A 3D atmospheric map delivers three classes of information at once, and each one changes what telescopes should look for next.
-
Winds and heat transport. On ultra hot Jupiters, intense starlight heats the dayside so strongly that hydrogen molecules can split into atoms. When those atoms blow toward cooler regions and recombine, they carry heat like a rechargeable hand warmer. A map that captures the size and shape of the hotspot and the temperature gradient around it tells us whether hydrogen dissociation and recombination dominate the energy budget, or whether high altitude absorbers and clouds are doing more of the work. That in turn sets expectations for how energy flows on cooler planets.
-
Chemistry in context. A single spectrum struggles to tell you whether a missing feature is truly missing or just hidden under a cloud deck. A 3D map lets you see where molecules are present, where they break apart, and where clouds flatten the spectrum. On WASP‑18b the hotspot shows less water than the average dayside, consistent with thermal dissociation near the substellar point. That is a specific, falsifiable pattern, not a vague claim that clouds might be to blame.
-
Model calibration for a population. Climate models for exoplanets have always had a validation problem. We could tune them to match one or two spectra, but not the spatial structure. With eclipse maps at multiple wavelengths, modelers can constrain winds, vertical mixing, and radiative timescales simultaneously. That means the next generation of models will predict not just average temperatures, but the shape of the hotspot and the phase lag of the thermal emission as a function of wavelength. Those are the predictions observers can confirm or refute quickly.
The near term: from one map to dozens
WASP‑18b is the opening act, not the finale. Eclipse mapping is data efficient, so JWST can scale it to many bright hot Jupiters in the next two years. The recipe is straightforward. Choose a system where the planet is large and the star is bright. Observe a single secondary eclipse with an instrument like NIRISS or NIRSpec to cover the right wavelengths. Fit a map at each wavelength, then stack the set into a 3D structure.
Two improvements will push quality up while keeping time demands down. First, better priors and cross validation can keep the maps honest about what ingress and egress can truly resolve, avoiding overly confident latitude features. Second, multi eclipse programs on a few touchstone planets will reduce random noise by simple averaging, then use phase curves on either side of the eclipse to lock down wind shifts.
Hot Jupiters like WASP‑43b, WASP‑76b, and HD 189733b are natural follow ups. They are bright, well studied, and they offer contrasting cases in cloudiness and stellar type. On each, a single 3 to 5 hour observation can deliver a layered temperature map and at least first order chemical contrasts. By the end of 2027 there could be a dozen 3D maps of hot Jupiters, spanning a range of irradiation levels and metallicities.
Next up: mini‑Neptunes and the cloudy middle
Mini‑Neptunes have cooler atmospheres and often carry high altitude hazes. Their spectra look muted, which made them frustrating early JWST targets. Eclipse mapping gives them a second life. Patchy clouds produce stronger spatial contrasts than globally uniform haze. By comparing water absorbing wavelengths to relatively transparent windows, a 3D map can place the cloud deck and measure how it varies around the limb.
Planets like GJ 1214b and K2‑18b will test this idea. GJ 1214b is small and cool with a famously flat spectrum, a classic hazy case. K2‑18b is larger and warmer with hints of methane and carbon dioxide, and controversy over whether the data demand additional molecules. A 3D view can ask a simple question that 1D retrievals cannot answer cleanly. Do the features strengthen on the limb where clouds thin, and do they weaken over any bright hotspot where molecules thermally break apart. Even a coarse answer would tell modelers whether to prioritize photochemistry, vertical mixing, or cloud microphysics for this class of planets.
The hard mode: super‑Earths and lava worlds
Super‑Earths are small, so their thermal signals are faint. But a subset provides a practical path in the next two years. Ultra short period rocky planets such as 55 Cancri e are incandescent. They glow enough in the infrared that an eclipse can be measured precisely, and the ingress and egress phases are minutes long but detectable. A spectroscopic eclipse series on a lava world could map the location of the hottest lava seas and search for a tenuous atmosphere by looking for altitude dependent differences across wavelengths. Even a null result, a surface map that does not change with wavelength, would help, because it would limit atmospheric pressure and composition.
For temperate super‑Earths around small red dwarfs, the thermal signal is weaker, but phase curves that run for several orbits and a handful of eclipses can be stacked. The payoff is understanding whether these planets have atmospheres at all and how effectively they move heat from day to night. If the day side is too hot and the night side too cold, that hints at atmospheric loss. If the contrast is small, that points to winds and perhaps clouds.
Real time weather at light year scales
Weather is not static. Jets meander, clouds form and dissipate, and chemistry follows. Because eclipse mapping requires only hours per visit, teams can revisit touchstone planets to watch change unfold. With three or four maps of the same planet spaced over months, you can look for the hotspot drifting east or west, perhaps following changes in stellar activity. You can check whether the cooler ring grows brighter at wavelengths that probe below cloud level, a sign of clearing. Most exciting, you can track chemical contrasts that move with wind patterns, a direct probe of transport timescales.
This is the kind of time domain climate science that solar system missions pioneered at Jupiter and Saturn. For an Earth based parallel in survey cadence, see how Rubin Observatory’s first images switched on the real time sky firehose.
Why this accelerates Roman and ELT science
The Nancy Grace Roman Space Telescope is being prepared for launch by May 2027, with teams at NASA Goddard, the Jet Propulsion Laboratory, and partners like BAE Systems, L3Harris Technologies, and Teledyne delivering hardware and software. Roman will survey the sky at scale and demonstrate high contrast imaging with a coronagraph, a crucial step toward a future Habitable Worlds Observatory. NASA recently shared the plan for its surveys and operational cadence, details that matter for exoplanets and for the broader community. See the official overview of Roman mission survey plans for timelines and scope.
What does a catalog of 3D hot Jupiter and mini‑Neptune maps do for Roman. Two concrete things.
-
It ranks direct imaging targets with real physics. The contrast and phase behavior of a planet depend on its clouds, albedo, and chemistry. Maps tell you which systems are likely to yield reflected light detections with a coronagraph and which are time sinks. If a warm giant has a bright reflective ring near the limb and a muted hotspot, that is a better coronagraph target than a cloud free giant with a dark dayside.
-
It calibrates population models. Roman will find thousands of planets through microlensing and will directly image dozens of nearby giants. To translate those detections into demographics and to plan follow up, you need climate priors. A set of maps gives those priors, tying cloud properties and metallicity to stellar type and irradiation. That means sharper predictions for how many promising worlds Roman will see in reflected light and which will have spectra worth the time of future flagship missions. For a complementary space mapping effort, compare with Euclid’s first cosmic map.
The Extremely Large Telescope class on the ground, including ESO’s ELT in Chile, the Giant Magellan Telescope, and the Thirty Meter Telescope, will add a complementary power. With high resolution spectroscopy these facilities can measure the Doppler shifts of molecules directly, which reveals wind speeds and directions. JWST’s maps tell you where the air is hot and where key molecules live. The ELTs can then measure how fast that air is moving and whether it is rising or sinking, by resolving line shapes and shifts across phase. The combination turns weather pictures into weather movies.
From discovery to characterization, with actions that matter now
Here is what the field can do right away to capitalize on the 3D mapping era.
-
Build a public atlas. Use a common format for eclipse maps, contribution functions, and retrieval posteriors. Host them alongside spectra from early JWST programs. This lets modelers test general circulation models on the same inputs and makes it easy to compare planets apples to apples.
-
Preselect Roman and ELT targets with map informed metrics. Define a transparent scoring system that mixes observable contrast, predicted cloud coverage, and spectral feature depth. Publish the scores before time allocation deadlines so that community proposals can converge on the best sets of systems.
-
Fund and share fast mapping tools. Groups have already developed algorithms that retrieve temperature maps at each wavelength and then stack them into 3D structures. Package these tools with robust cross validation, include simple tests that guard against overfitting at ingress and egress, and make them reproducible on commodity cloud instances.
-
Coordinate time domains across observatories. Reserve a handful of planets for repeat mapping. Pair those with stellar monitoring for flares and spots, so any weather variability can be compared against the star’s mood. The aim is a clean detection of change in the planet, not an artifact of the star.
-
Teach the catalog. Educators and communicators can turn these maps into a planetary weather report series for non specialists. The first time a student sees a forecast for a world four hundred light years away, exoplanets stop being abstract. They become places.
The road to biosignatures runs through climate
Biosignatures will always demand a chain of evidence. That chain starts with a planet that has the right temperature profile and the right balance of gases. It requires weather that can redistribute heat without destroying fragile molecules. And it benefits from clouds that reflect the star’s worst radiation while letting helpful photons through. 3D maps provide exactly this context. They tell you whether the atmosphere is vertically mixed, whether winds will smear out day night contrasts, and whether high altitude hazes will hide key gases. When Roman and, later, a coronagraph equipped flagship pull reflected light from temperate worlds, teams will know which ones have the climate physics that make life plausible and detectable.
A new way to watch the universe breathe
We are at the beginning of a catalog that reads like a meteorologist’s notebook. Hotspot drifting two degrees east. Water features deeper at the limb. Nightside cloud deck lifting after a stellar flare. As the pages fill, target lists for Roman and the Extremely Large Telescopes will sharpen, retrievals will grow more realistic, and the search for life will become a question of climate as much as chemistry. The alien weather report has arrived, in three dimensions, and it turns distant points of light into worlds with patterns we can study, compare, and someday forecast.