IMAP lifts off: a new early warning stack at L1 for space weather
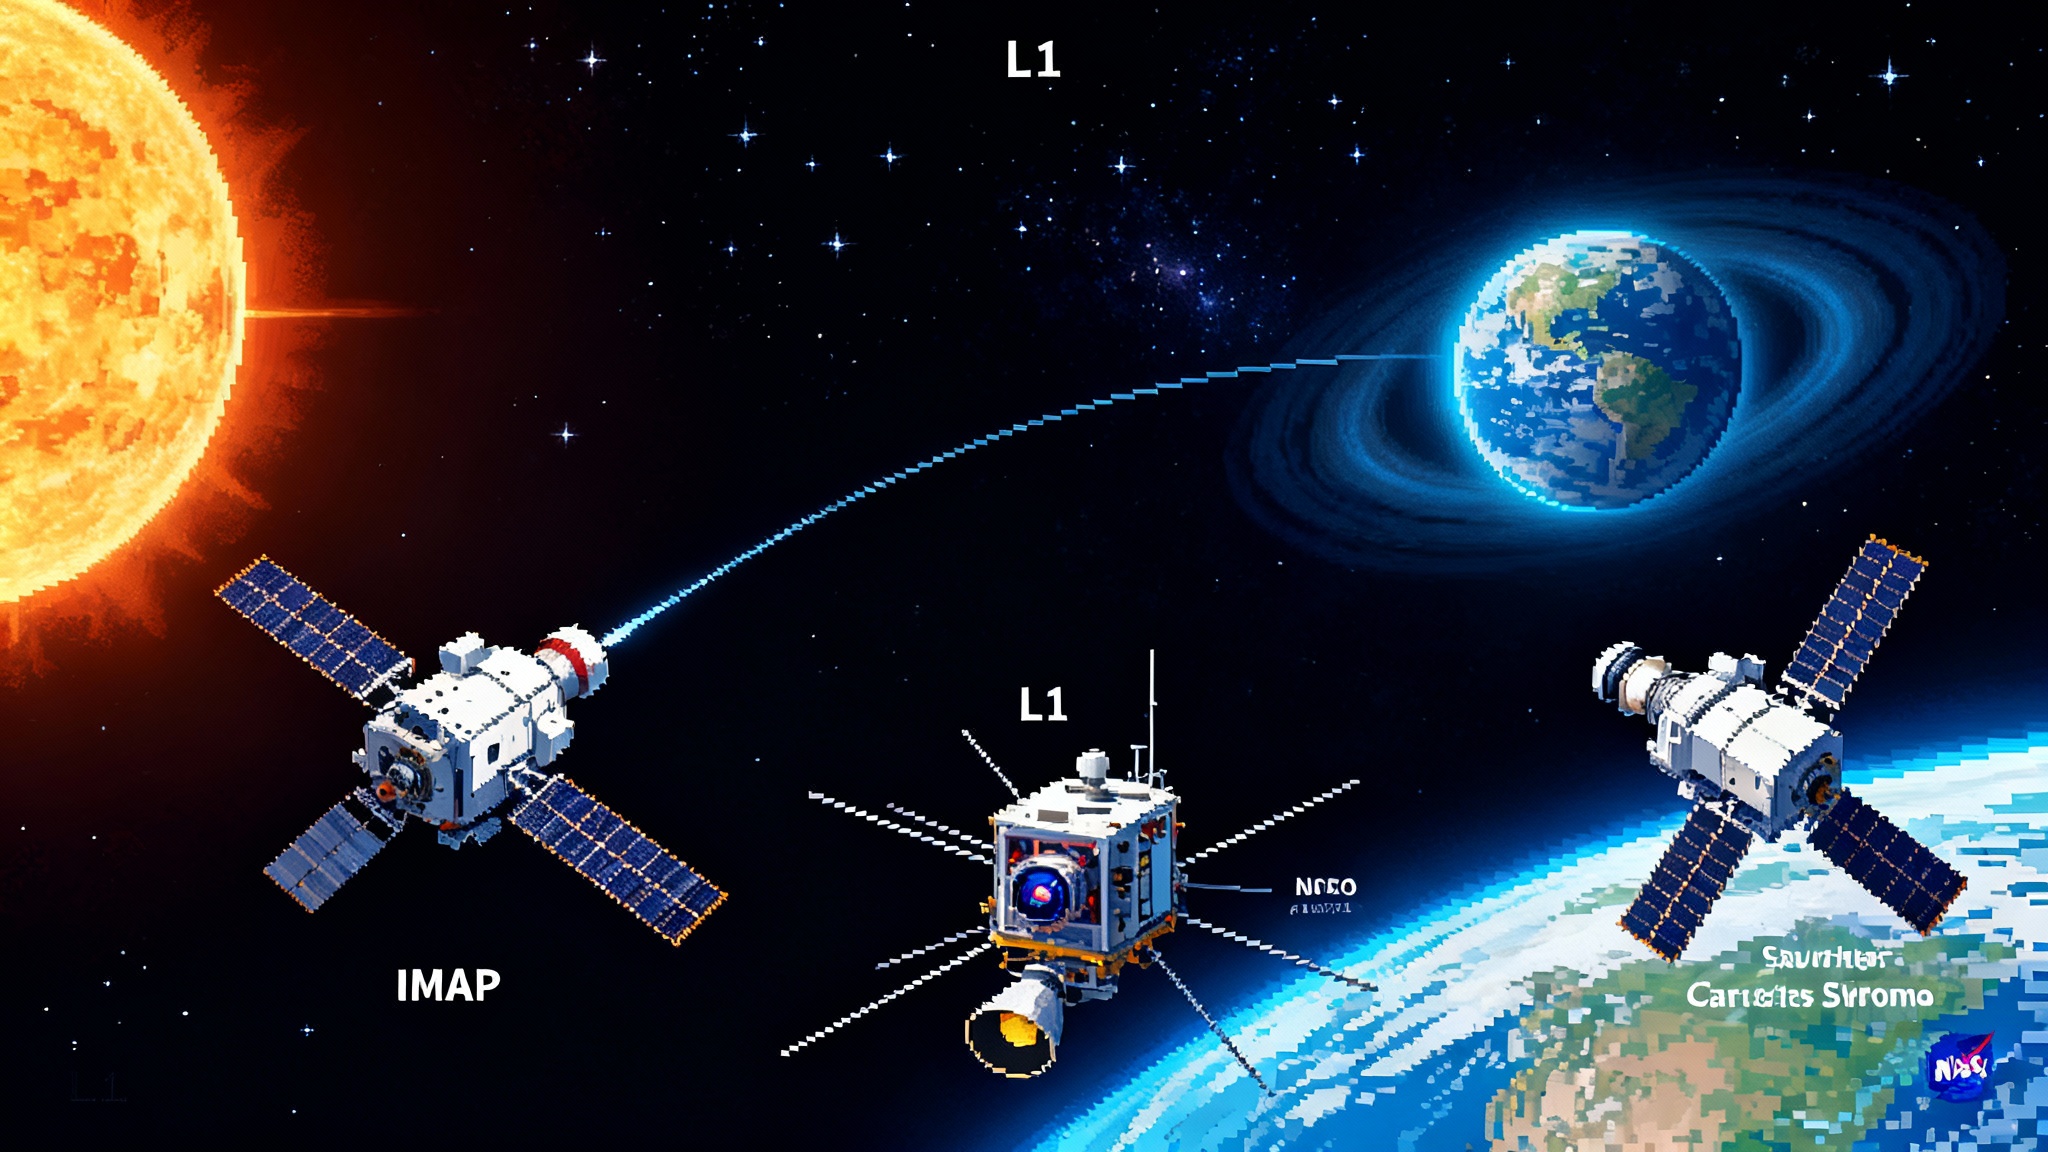
On September 24, 2025, a Falcon 9 launched NASA’s IMAP, NOAA’s SWFO‑L1, and the Carruthers Geocorona Observatory toward L1. Together they create an upstream early-warning stack that shifts space-weather risk from reaction to prediction.
A three-craft launch that changes the forecast
At 8:00 a.m. Eastern on September 24, 2025, a SpaceX Falcon 9 rose from Cape Canaveral carrying three spacecraft with a single shared purpose: make the invisible forces of the Sun legible, actionable, and on time. NASA’s Interstellar Mapping and Acceleration Probe, better known as IMAP, rode upstairs with NOAA’s Space Weather Follow-On mission to L1, or SWFO-L1, and NASA’s Carruthers Geocorona Observatory. Together they are headed for a gravitationally balanced point about one and a half million kilometers sunward of Earth. From there, they will watch the solar wind head toward us, map the bubble that shields our solar system, and bring space weather into the age of routine, data-driven early warning. NASA captured the milestone in its official announcement, which also explains how the missions complement each other across science and forecasting in a single NASA and NOAA launch release.
Think of L1 as the highway median where you can spot traffic before it reaches your lane. The solar wind races down that highway at hundreds of kilometers per second. If you station monitors at L1, you get precious minutes to an hour or so of lead time depending on the storm. That is the difference between bracing for a gust and having a plan for a gale.
Why L1 is the perfect storm lookout
Space weather becomes hazardous when charged particles and magnetic fields from the Sun couple efficiently with Earth’s magnetic shield. The worst impacts occur when a coronal mass ejection carries a strong southward magnetic field. That configuration can pry open the door to our magnetosphere and drive geomagnetic storms that disturb satellites, radio systems, and power grids.
The trio launched on September 24 is designed for complementary roles at this exact pinch point in the Sun-Earth system. SWFO-L1 sits on the front line, sampling the solar wind’s speed, density, temperature, and magnetic field orientation. The Carruthers Geocorona Observatory watches the hydrogen glow of Earth’s extended exosphere. That view helps disentangle how incoming solar particles and fields interact with our near-Earth environment. IMAP does double duty. It carries instruments that taste the solar wind locally at L1 and, crucially, looks far outward by detecting energetic neutral atoms that backlight the vast, faint edges of the Sun’s protective bubble, the heliosphere.
This is a stack by design. When you integrate real-time measurements of the wind that is about to arrive, the state of the Earth’s outer atmosphere, and a deeper context for how the entire solar bubble modulates cosmic radiation, the forecast stops being a guess based on yesterday’s storm and becomes a living model fed by fresh data.
From reactive to predictive
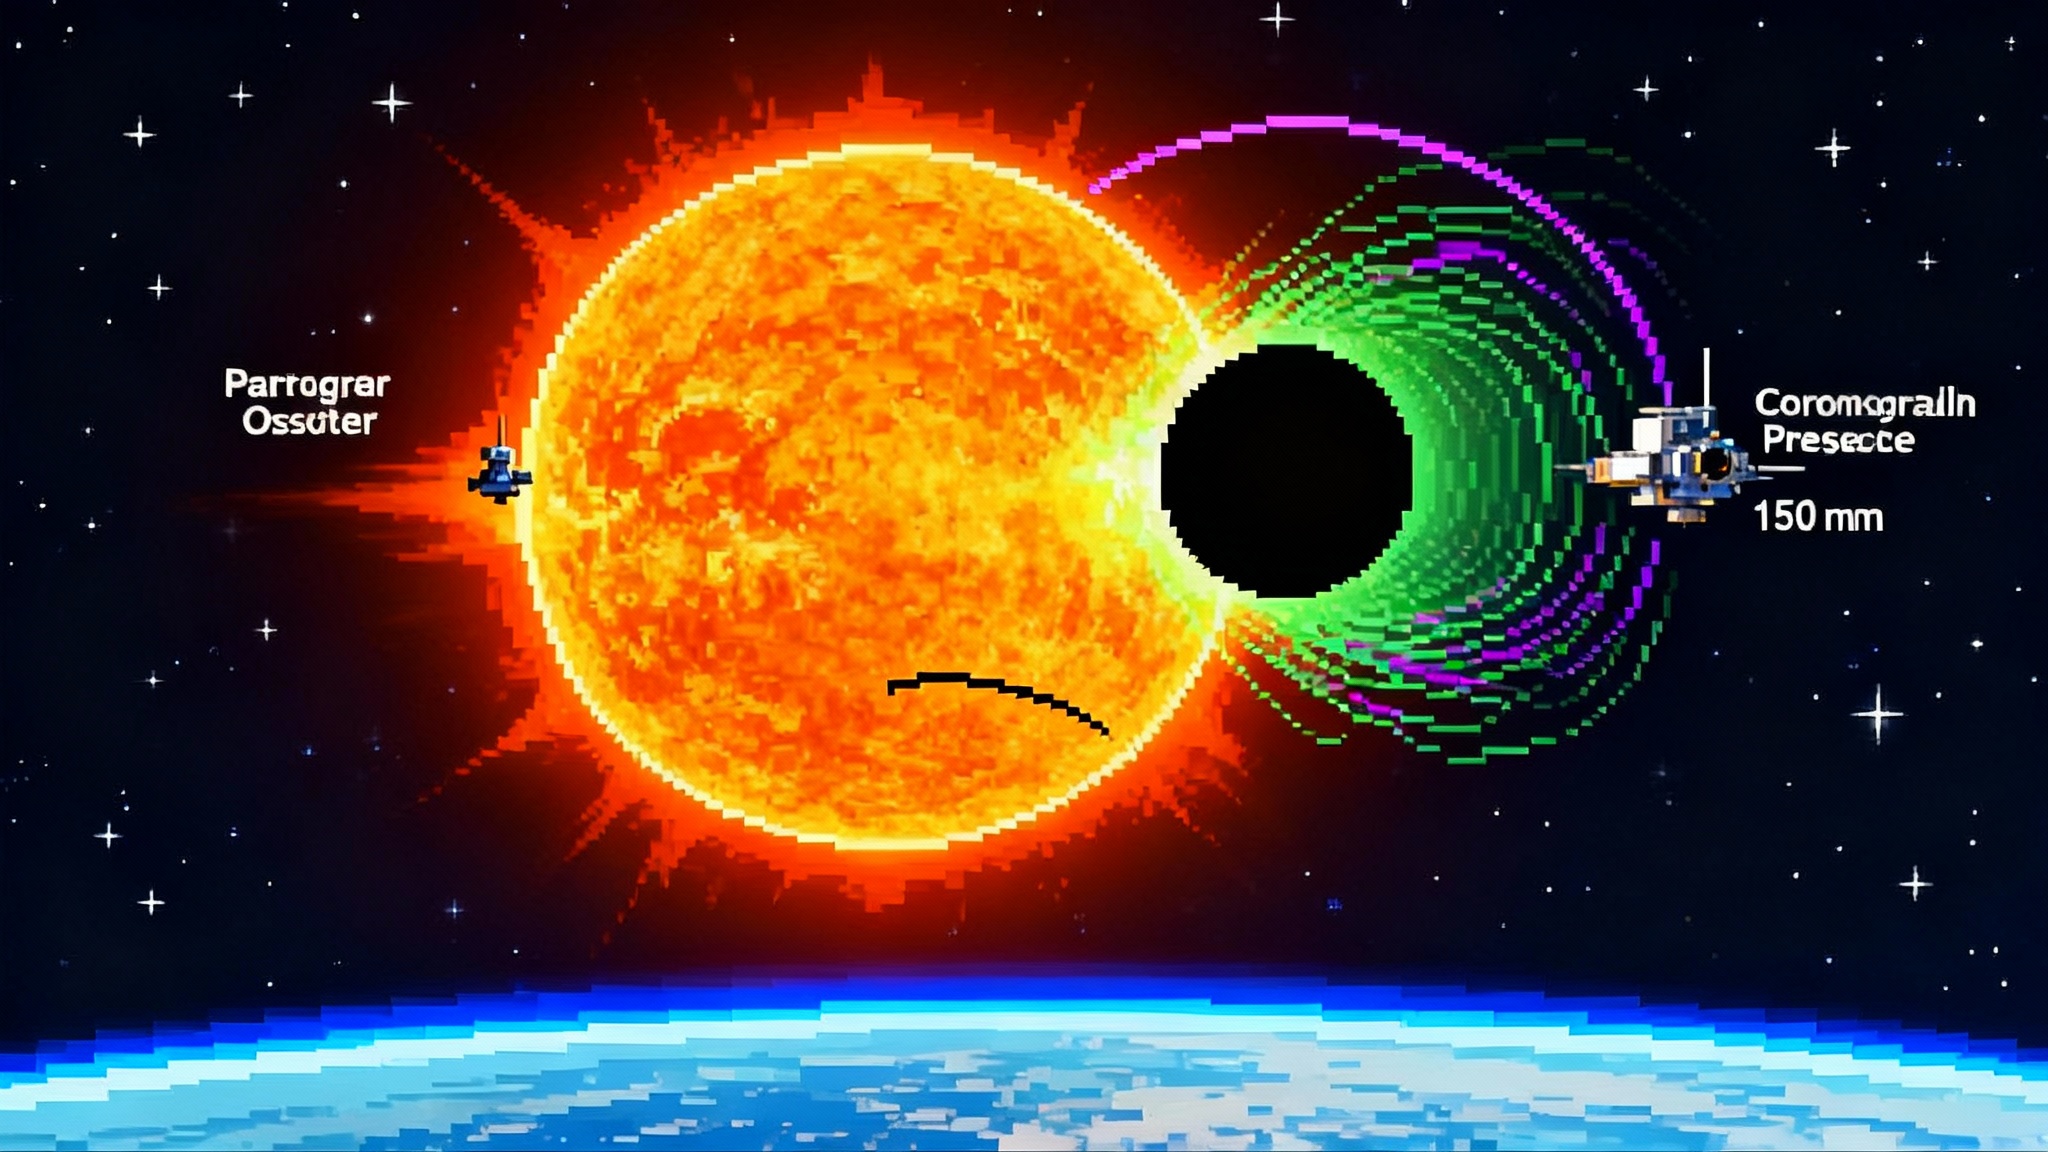
Until now, much of space-weather response looked like this: see an eruption on the Sun, infer its speed from coronagraph images, estimate arrival in a day or two, then wait for L1 to confirm the impact about an hour before the hit. That hour was often spent flipping satellites into safe mode, retasking ground stations, and calling grid operators. It worked, but it was reactive. The new L1 stack upgrades the whole pipeline.
With SWFO-L1 upstream, operators will get continuous, high-cadence readings of the interplanetary magnetic field and solar-wind plasma. The Carruthers observatory provides a health check on the interface region where that wind first brushes Earth. IMAP stitches these inputs into a bigger story about the particles that pervade interplanetary space. Together they give forecasters at national centers and commercial providers a better handle on the likely severity of a storm before it arrives and a clearer picture of how long it will last.
For the Artemis program and commercial deep-space missions, this is not academic. Dose budgets for crews are planned months ahead, but they are managed in hours and minutes. A forecast that says a storm will likely drive proton flux beyond a mission’s limits allows controllers to reschedule extravehicular activities, adjust trajectory windows, or send a crew into a storm shelter lined with water or polyethylene that slows high-energy particles. The difference between a 15-minute scramble and a 60-minute plan is the difference between reactive risk and predictive control. That planning also intersects with vehicles and architectures described in the Starship’s 2025 refueling pivot.
IMAP’s big science: imaging an invisible frontier
IMAP’s headline promise is as audacious as it is elegant: paint the first detailed, global maps of the boundary where the Sun’s influence yields to the interstellar medium. The spacecraft does this by catching energetic neutral atoms, or ENAs. An ENA is born when a fast ion picks up an electron during a distant collision and goes neutral. Because it is neutral, it flies in a straight line, immune to magnetic fields. If you collect enough of these particles and measure their energies and arrival directions, you can infer what is happening in the faraway region they came from.
We got a first taste of this method from NASA’s Interstellar Boundary Explorer, known as IBEX, and from instruments on Cassini. IBEX revealed a mysterious ribbon across the sky where the flux of ENAs spikes. The ribbon told scientists there is a subtle alignment between the local interstellar magnetic field and the flow of particles at the edge of the heliosphere. IMAP brings far sharper sensitivity, improved energy coverage, and faster sky scans. That means higher confidence in the structure and dynamics of the boundary, and a chance to catch it evolving during the current solar cycle.
Why should operators on or near Earth care about a frontier more than 100 astronomical units away? Because the heliosphere is a shield. It modulates the rate at which high-energy galactic cosmic rays reach the inner solar system. During solar maximum, when the Sun is active, the heliosphere puffs up and cosmic rays dip. During solar minimum, the shield slackens and cosmic rays intensify. IMAP’s maps will let scientists test and improve models that couple solar-cycle activity, heliospheric structure, and cosmic-ray transport. Those models feed radiation planning for long-duration missions in cislunar space and beyond, alongside lunar infrastructure like the Moonlight and LunaNet navigation grid.
The early-warning stack in practice
Here is what the next storm might look like with the new stack in place:
- Days before arrival: Coronagraphs on multiple spacecraft, including insights from Proba-3 artificial eclipses, pick out a coronal mass ejection’s speed and width. Models predict a likely arrival window at Earth. Operators prepare, but no one overreacts.
- Hours before arrival: The Carruthers observatory reports changes in the geocorona that hint at a compressed magnetospheric boundary as the upstream wind intensifies. Forecast confidence in a meaningful impact rises.
- Tens of minutes before arrival: SWFO-L1 measures a sharp increase in solar-wind speed and density. It also records a persistently southward magnetic field. Forecasters issue a high-likelihood warning for a strong geomagnetic storm. IMAP cross-checks with local particle data to refine the expected radiation environment.
- During impact: Combined measurements feed data-assimilation models that update storm strength, duration, and recovery in near real time. Operators iterate their playbooks with up-to-the-minute situational awareness.
With each step, the system shifts from reactive to predictive. Nothing is guaranteed, but confidence bands tighten and actions become timely rather than frantic.
Milestones ahead: cruise, commissioning, first data
The journey to L1 takes months, not days. After the September 24 launch, the three spacecraft began cruise operations that include trajectory corrections and deployments. Arrival in the L1 halo orbit is expected after several months of transit. Each mission then enters a commissioning phase in which instruments are powered on, calibrated, and cross-checked against one another and against heritage datasets. For IMAP, the goal is to deliver initial science-quality maps in 2026, followed by regular sky surveys. SWFO-L1 and the Carruthers observatory will also ramp from engineering data to operational products as their calibrations mature in 2026.
That cadence matters. Solar cycle 25 is peaking, which means more frequent solar eruptions and a livelier radiation environment. Bringing the full L1 stack online while the Sun is active will maximize the value of early datasets and stress-test the forecasting chain under real pressure.
Implications for astronaut dose planning
Radiation is the hardest environmental hazard for human exploration beyond low Earth orbit. It cannot be seen or felt until effects accumulate. Mission designers juggle three levers: shield what you can, minimize time at risk, and steer away from the worst conditions. The new stack helps with all three.
- Shielding: IMAP’s data on the larger heliospheric context improves long-term predictions of cosmic-ray background levels. That supports better sizing of water walls, polyethylene placements, and storm shelters for vehicles like Orion and commercial cislunar transports.
- Time management: SWFO-L1 provides the upstream alert that lets flight directors move a spacewalk or translunar injection out of a high-risk window. A 30 to 60 minute heads-up is the difference between a hurried retreat and an orderly replan.
- Steering: For missions with some trajectory flexibility, upstream knowledge of the solar-wind magnetic orientation can help choose paths or timing that trade a small propellant penalty for a meaningful risk reduction.
Practically, this means Artemis planners can codify radiation flight rules that are sensitive to upstream, real-time thresholds rather than blunt, fixed margins. Commercial providers planning deep-space tourism or logistics runs can build similar playbooks into their operations software.
Satellite operations at solar max
Satellites are the economy’s quiet backbone. Navigation, timing, communications, imaging, and weather all depend on on-orbit assets. Space weather threatens them through surface charging, deep dielectric charging, single-event upsets in electronics, and atmospheric drag in low Earth orbit.
- Constellation managers can use upstream L1 data to adjust pointing and power modes before a storm. For fleets like Starlink and OneWeb, this can avoid mass safe-mode entries that disrupt service.
- Operators of high-value geostationary satellites can plan payload offloads, switch to radiation-hardened modes, or defer maneuvers that are sensitive to magnetic disturbances.
- Mission assurance teams can tune anomaly triage thresholds. If a spike in bit flips coincides with SWFO-L1 readings, teams can attribute faults quickly and avoid unnecessary hardware swaps.
- In low Earth orbit, drag forecasts improve when models assimilate storm-driven density changes. That reduces collision risk and extends satellite lifetime by avoiding overcorrection and wasted propellant.
The key is not just the extra minutes of warning. It is the improved characterization of what is inbound. A fast wind with a benign magnetic orientation may be a non-event. A moderate-speed cloud with a strongly southward field can be far worse. Knowing which is which cuts false alarms and focuses scarce operator attention.
Power grids and the physics of hardening
Geomagnetically induced currents, or GICs, occur when a storm perturbs Earth’s magnetic field and electric fields drive quasi-direct currents through long conductors such as power lines. Those currents can saturate transformer cores and heat windings, pushing equipment toward damage.
Grid planners already model GIC risk using ground conductivity maps, line orientations, and transformer designs. The missing piece has been reliable, specific lead time on the storm’s magnetic orientation and strength. The L1 stack delivers that missing piece.
- With tens of minutes of notice that a southward magnetic field is incoming, operators can reduce long-distance transfers that load vulnerable corridors.
- They can temporarily adjust transformer tap settings and reactive power resources to increase thermal headroom.
- They can stage crews near substations that the model flags as hotspots and pre-position mobile monitoring units.
- During the storm, streaming upstream data lets planners switch from generic Kp-based postures to localized, model-driven actions that care about direction and rate of change, not just overall magnitude.
The result is fewer unnecessary derates during harmless events and faster reactions when a real hazard builds. For utilities that must defend reliability down to the minute, that is a material difference.
What to do now: playbooks for the L1 era
Space agencies, companies, and infrastructure operators can start capturing value before the missions complete commissioning by updating playbooks around the new data sources.
- Flight directors and mission planners: Define go or no-go radiation thresholds that explicitly incorporate upstream magnetic field orientation and solar-wind density from SWFO-L1. Build automated alerts that feed into scheduling tools for spacewalks and engine burns.
- Commercial satellite operators: Integrate upstream data into anomaly correlation. If upstream parameters cross set thresholds, automatically raise the level of fault-protection autonomy and defer sensitive maneuvers.
- Launch providers: Use improved drag and ionospheric forecasts to select safer orbit-raising timelines and phasing strategies during active solar periods.
- Grid operators: Update GIC mitigation plans to condition actions on real-time upstream measurements. Run drills during moderate storms to validate that crews can execute posture changes within the available lead time.
- Insurers and underwriters: Tie premium discounts to demonstrated use of upstream data in risk mitigation. Reward customers who can show that they avoided outages or anomalies by acting on L1 alerts.
These steps only require data plumbing and procedural updates. They do not depend on new physics. The value is unlocked by turning upstream awareness into disciplined action.
The deeper story: a heliosphere we can finally sketch
IMAP’s maps will do more than guide near-term operations. They will help answer foundational questions about our home in the galaxy. How does the local interstellar magnetic field bend around the heliosphere? Does the Sun plow a bow wave or merely ripple the medium? How do pickup ions born from interstellar neutrals shape particle acceleration at the boundaries? Each answer tightens our understanding of how cosmic rays move through space and how the Sun’s cycle sculpts the bubble that all planets inhabit.
These insights flow into practical models for radiation dose on the surfaces of the Moon and Mars. They inform how we design habitats and choose routes for long-duration missions. They even shape how we interpret exoplanet atmospheres, where stellar winds and magnetic fields can strip gases and alter climates over geologic time.
A turning point you can feel
When weather satellites first gave us global imagery, it changed how we talked about storms. We stopped relying on local folklore and started planning with confidence. The September 24 launch is a similar hinge. With SWFO-L1, the Carruthers observatory, and IMAP all headed to their watch posts, space weather is becoming observable in the right place and at the right cadence.
Over the next year, as the trio cruises to L1 and commissions their instruments, expect a steady ramp of capability. In 2026, expect the first IMAP maps of the heliosphere’s far frontier and a more mature, data-assimilative forecast pipeline for solar storms. The result will be fewer surprises for spacecraft, more predictable dose for crews, and a sturdier grid on the ground.
We have spent decades learning to live with the Sun’s moods. Now we are finally learning to read them.