Inside the Corona: Parker’s 2025 Data Will Rewire Space Ops
Parker Solar Probe’s 2025 inside-the-corona passes are turning solar physics into engineering data. Live readings of wind lanes, magnetic switchbacks, and CME birth zones now map directly to decisions for crews, constellations, and power grids.

The Sun just became an engineering data source
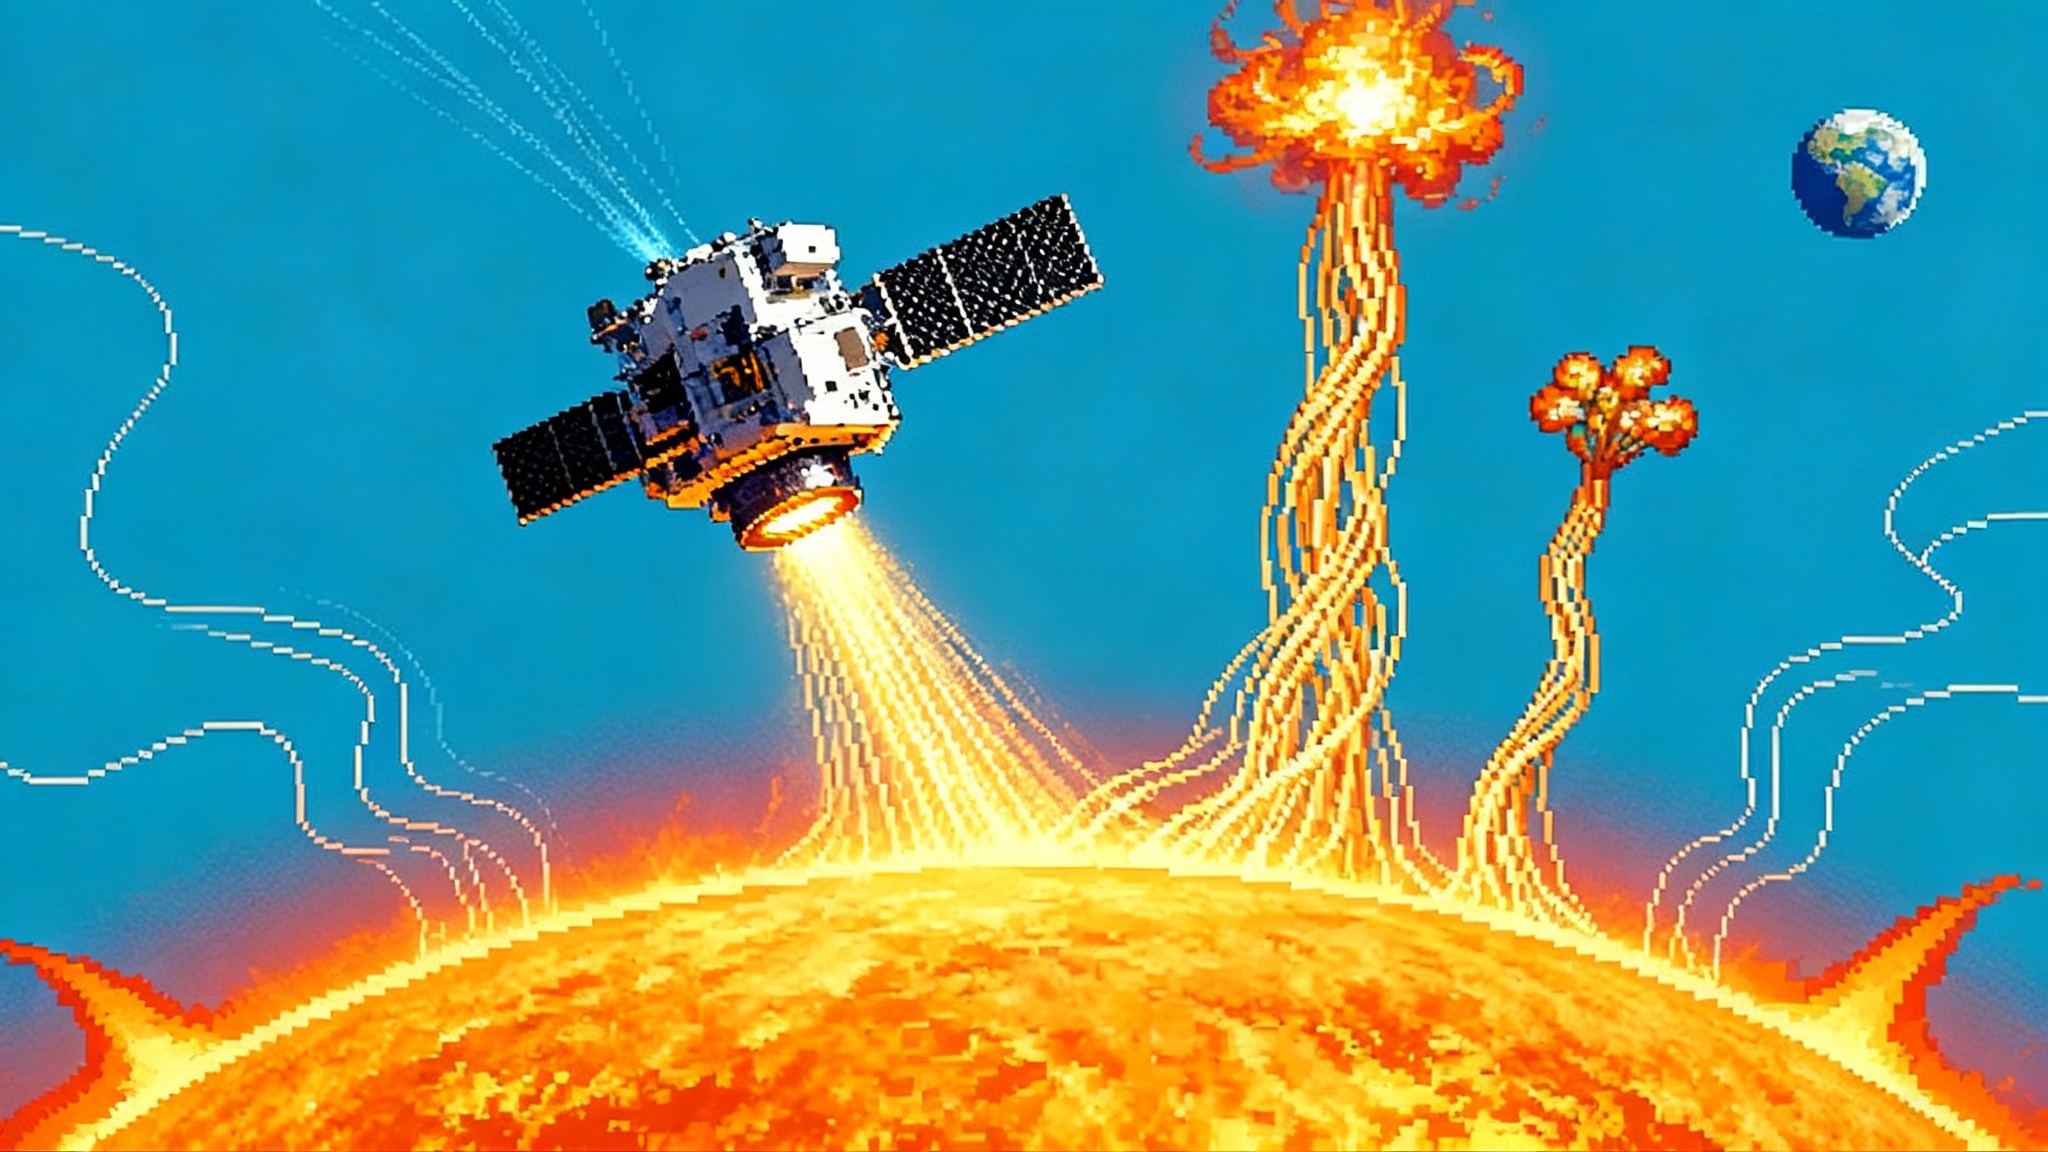
In mid September 2025, NASA’s Parker Solar Probe completed its 25th close brush with the Sun, again skimming just 3.8 million miles from the surface while blasting along at about 430,000 miles per hour. These are not just record stats. They are the foundation of a new kind of space operations that treats the Sun as a measurable, predictable system with knobs we can watch in real time. Parker’s latest passes inside the corona are delivering measurements that move heliophysics out of the realm of pure discovery and into the toolkit of engineers planning missions, operating constellations, and protecting terrestrial infrastructure. The proof point is tangible, documented by NASA’s report on the probe’s 25th close approach on Sept. 15, 2025.
If your job touches Artemis timelines, satellite reliability, or grid stability, the story is no longer an inspirational poster about the power of the Sun. It is a set of actionable inputs, defined by numbers, thresholds, and decision trees. The Sun is loud right now. Solar maximum for Cycle 25 is here, with NOAA’s Space Weather Prediction Center updating multiple times this year to show the peak window and intensity for 2024 to 2026, culminating in a revised forecast for 2025 that operators can use today. See NOAA’s experimental update for Solar Cycle 25 progression and peak window. For how coronagraphy complements in situ probes, see our explainer on on-demand eclipses to map the inner corona.
What Parker is actually seeing inside the corona
For decades we inferred space weather from a distance, mostly by watching the Sun’s surface and the near Earth environment. Parker changes the geometry. It samples the source region itself, inside the corona, closer than any mission in history. Three findings matter most for operations.
-
Solar wind structure is not a bland stream. It has lanes, ramps, eddies, and intermittent bursts of energy. Parker’s FIELDS and SWEAP instruments have recorded fast changes in density and magnetic orientation that map into practical trouble on satellites and power systems. Think of a mountain river at snowmelt, with smooth sections that suddenly hide standing waves. When those waves hit a bridge, the load swings.
-
Magnetic switchbacks are common inside the inner heliosphere. These are S shaped kinks where the magnetic field flips direction and then flips back. Picture a garden hose jerking back on itself when you crack open the spigot. Switchbacks are not mere curiosities. They are signatures of interchange reconnection near the base of open field lines, and they seed turbulence that determines how fast and how clumpy the wind becomes. That clumpiness redistributes energy and alters the acceleration of the particles that can fry electronics or dose crews.
-
Coronal mass ejection birth zones are sharper and more varied than models assumed. Parker has cut through the stalks of helmet streamers and skirted the flanks of expanding eruptions, capturing how shocks form and how multiple ejections can merge. For operators, this is the difference between planning for a single freight train and coping with an unexpected train that has coupled two more cars on the way.
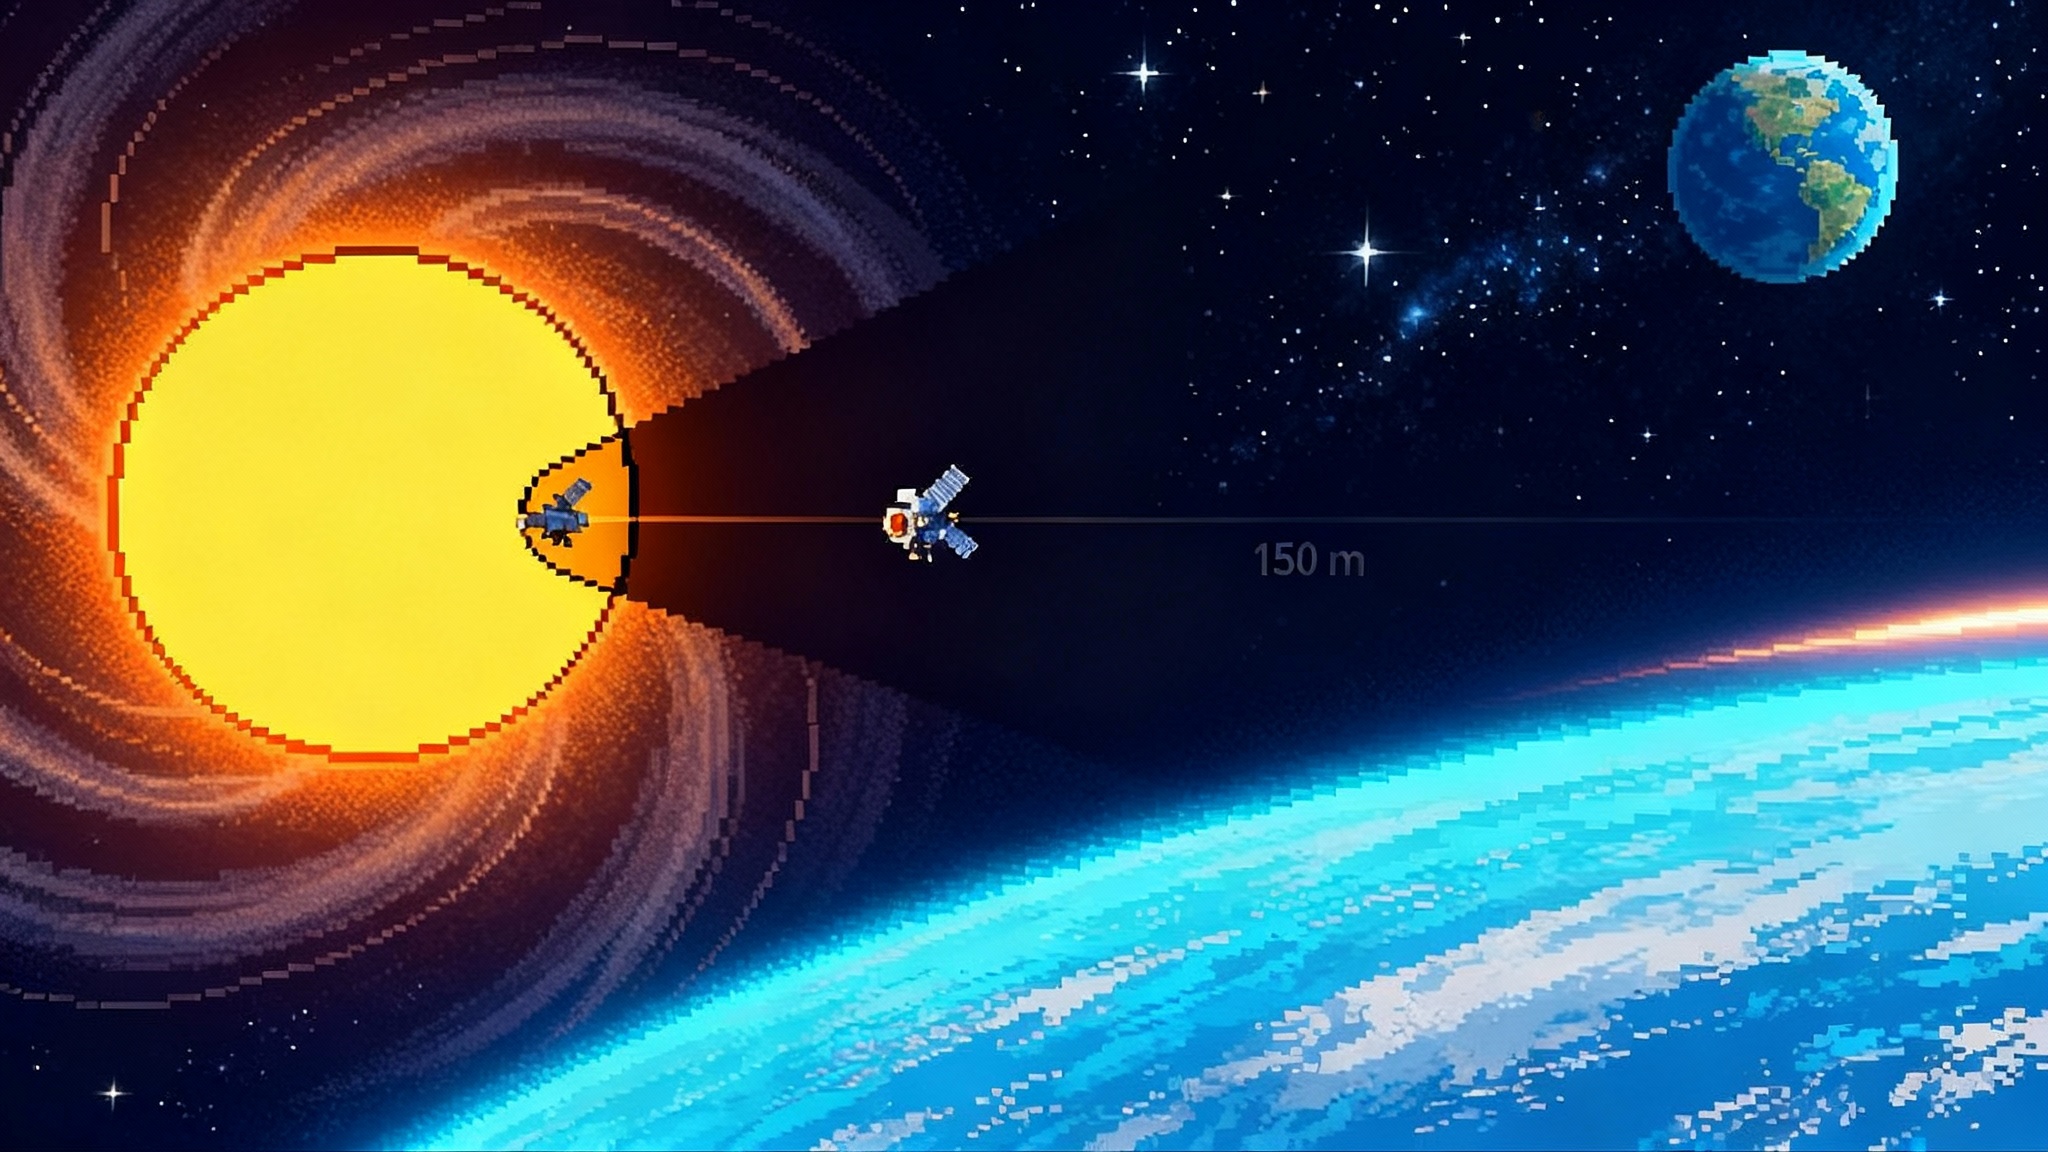
These measurements turn into practical gains because they occur upstream of Earth, upstream of lunar orbits, and upstream of many spacecraft that will live and work far beyond geosynchronous altitude. When you know the shape of the river near its source, you can see the flood crest early, not when it has already hit the levee.
Artemis crews: from caution to calibrated choice
The United States is returning crews to the Moon this decade. That means real humans in habitats and suits that cannot hide behind Earth’s magnetic blanket. Parker’s data inside the corona is a lever for better go or no go calls, smarter extravehicular activity windows, and safer safe haven strategies. For mission logistics context, see how a recent operations rethink reset lunar surface logistics.
- Earlier, sharper warnings for solar energetic particle events. Right now, many alerts are triggered when instruments near Earth see the rise. Parker gives a view minutes to hours closer to the accelerator itself. That lead time is the difference between a routine delay and a scramble.
- Better spectra for dose models. Radiation risk calculations for Orion, Gateway, and surface suits depend on which particle energies dominate an event. Parker’s in situ spectra near the source help tune the tails of the distribution that drive shielding thickness and time to threshold dose. Feed those spectra into updated versions of models like Badhwar O’Neill and you reduce the spread between conservative design and likely reality.
- Activity windows that match the Sun’s lanes. EVA planning can use the new map of slow wind corridors and magnetic connectivity to pick periods with lower switchback turbulence, which correlates with calmer particle acceleration. If a surface team can slide a moonwalk by even 30 minutes to miss a spike in turbulence, cumulative dose and communications margin both improve.
- Smarter safe haven rules. A good safe haven is not just a thicker wall. It is a protocol. With Parker’s upstream alerts, Gateway can rotate assets to maximize mass between the storm direction and the crew, turn off non essential electronics to lower noise, and reset the clock on a planned EVA to stay within risk budgets.
Action item for 2026 mission planning: build Parker data streams into NASA flight rule logic. That means adding a pre EVA gate that checks two indicators. First, a switchback turbulence index calculated from recent Parker passes that correlates with acceleration risk. Second, a near source proton spectral slope that tightens dose predictions. When either threshold is crossed, crews delay or shorten their EVA. This is not an abstract recommendation. It is a new line in a console checklist.
Mega constellations: design knobs that pay for themselves
Space is already crowded with satellites that sell bandwidth and sensing by the terabit and the terabyte. Starlink, OneWeb, and Amazon’s Project Kuiper are building fleets that fly through plasma and particles that change minute by minute. Parker’s inside the corona data should show up in two places: board level design and operations playbooks. For how space weather shapes operations beyond Earth, see this mission that rewrites the interplanetary playbook.
Hardware decisions to make now:
- Latch up and single event resilience. Use Parker informed particle spectra to recalculate single event upset rates for worst weeks during solar maximum, not average years. Hardened regulators and current limiters lower catastrophic latch ups. Error correction codes that can handle burst errors during clumpy wind intervals cut down on customer visible glitches.
- Shielding where it counts. A millimeter of aluminum is not a magic number. Use Parker’s spectral tails to place mass over the devices that matter most, then leave the rest alone. You get resilience without paying a mass tax across the bus.
- Sensor filtering. Parker has quantified density ramps and turbulence scales that drive star tracker jitter and sun sensor noise. That data justifies adding predictive filters and mode logic that gate attitude control when the plasma environment lies outside expected bounds.
Operations decisions to make this quarter:
- Forecast aware scheduling. When Parker’s upstream measurements point to a shock arrival, constellations should preposition. Upload commands, close cross link loops that are sensitive to bit flips, and defer high risk firmware loads until after the passage.
- Graceful fallbacks. Live the failure. Increase redundancy on forward error correction and lower modulation schemes for a few hours. Customers will notice a small throughput hit far less than they will notice a total outage.
- Fleet health analytics. Use Parker’s switchback index and CME structure flags to annotate anomaly logs. In three months you will see patterns that turn mysterious resets into predictable, preventable events.
These steps are not charity toward science. They add revenue days by shrinking the space weather share of unscheduled downtime.
Power grids: hour ahead becomes a tool, not a hope
Grid operators like PJM, ISO New England, and ERCOT already monitor NOAA bulletins and magnetometer feeds. Parker creates a class of hour ahead products that can ride alongside wind and load forecasts.
- Shock front clocks. When Parker cuts through the leading shock of a coronal mass ejection near the birth zone, the event geometry and strength can be paired with ensemble solar wind models to deliver a better arrival clock at Earth. The result is an hour ahead alert with tighter bounds. Operators can temporarily reduce long line loading, prepare extra reactive power, and delay maintenance switching.
- Transformer friendly dispatch. Geomagnetically induced currents couple into long conductors and saturate transformer cores. With a narrower uncertainty window, you can preposition tap changers and reactive compensation to keep the system closer to the sweet spot that avoids core saturation.
- HVDC posture changes. Long direct current links can provide a sink for geomagnetically induced current if they are set up right. Parker driven alerts give operators time to shift pole configurations and rectifier controls to reduce stress.
- Fewer false alarms. Operators hate crying wolf. Parker’s upstream view helps cut false positives by distinguishing compact, geoeffective ejections from beautiful but harmless eruptions.
A practical rollout looks like this. NOAA incorporates Parker’s corona data into its operational models, the same way numerical weather prediction assimilates data from aircraft and radiosondes. Grid control rooms subscribe to a derived product that shows three numbers on the operator’s display: probability of strong geomagnetically induced currents over the next two hours, best estimate of arrival time with a plus or minus range, and expected duration. That is enough to change dispatch without chasing shadows.
Why inside the corona data beats old guesses
You can only predict what you can sample. Remote imaging shows hot loops and bright arcs, but it does not capture the local magnetic topology that decides how particles are accelerated or how shocks steepen. Parker’s close in measurements resolve the scale of turbulence that matters to energy transfer, and the geometry of the magnetic field that locks in connectivity between the source and Earth.
- Magnetic connectivity matters. A powerful event is only dangerous if field lines connect it to our neighborhood. Parker maps that connectivity in real time, reducing guesswork about which eruption is relevant. That is operational gold for astronauts and satellites.
- Turbulence is not noise, it is a transport mechanism. Switchbacks and their surrounding flows tell us how energy moves from the Sun to the wind. When turbulence climbs, particle acceleration can spike. That correlation becomes a threshold you can watch, not a hand wave in a briefing.
- Merged ejections change the rules. When coronal mass ejections catch up to each other, the combined structure can produce stronger geomagnetic storms than either would alone. Parker has flown through these mergers near their formation region, giving modelers the initial conditions they have lacked for decades.
Building the pipeline from science to operations
Turning Parker’s measurements into operational advantages is a data engineering job as much as a science task. Here is a near term blueprint.
- Data routing and latency. Use a low latency path from NASA to the Space Weather Prediction Center, then expose a simplified stream to operational users. Deliver three derived indices at five minute cadence: switchback turbulence index, near source proton spectral slope, and CME shock strength proxy. If you can ingest more, add a magnetic connectivity likelihood score.
- Model assimilation. Feed Parker data into existing models such as WSA ENLIL and MAS. Build a thin wrapper that maps the indices above to model boundary conditions. Benchmark skill scores against historical events.
- Playbook integration. For Artemis, codify go or no go thresholds in flight rules and training sims. For satellite fleets, write standard operating procedures that hook environment alerts to safe mode decisions, firmware windows, and antenna scheduling. For grids, publish a one page operating guide that defines actions at each alert level and shows the expected benefit in reduced equipment stress.
- Feedback loops. Every event is a lesson. Log actions taken during alerts and compare them with outcomes. Tune thresholds quarterly.
- Contracts and governance. Specify service levels for space weather feeds the way utilities do for wind and load forecasts. If an alert is late, you should know by how much and why. If an alert is wrong, it should be visible in a post event dashboard.


