Euclid Q1 Turns the Dark Universe into an Open Map
On March 19, 2025, Euclid’s first public Q1 dataset arrived: 63 square degrees and roughly 26 million detections. Here is what is inside, why it already matters for weak lensing and lens hunting, and how to get started today.
The map switch flips on
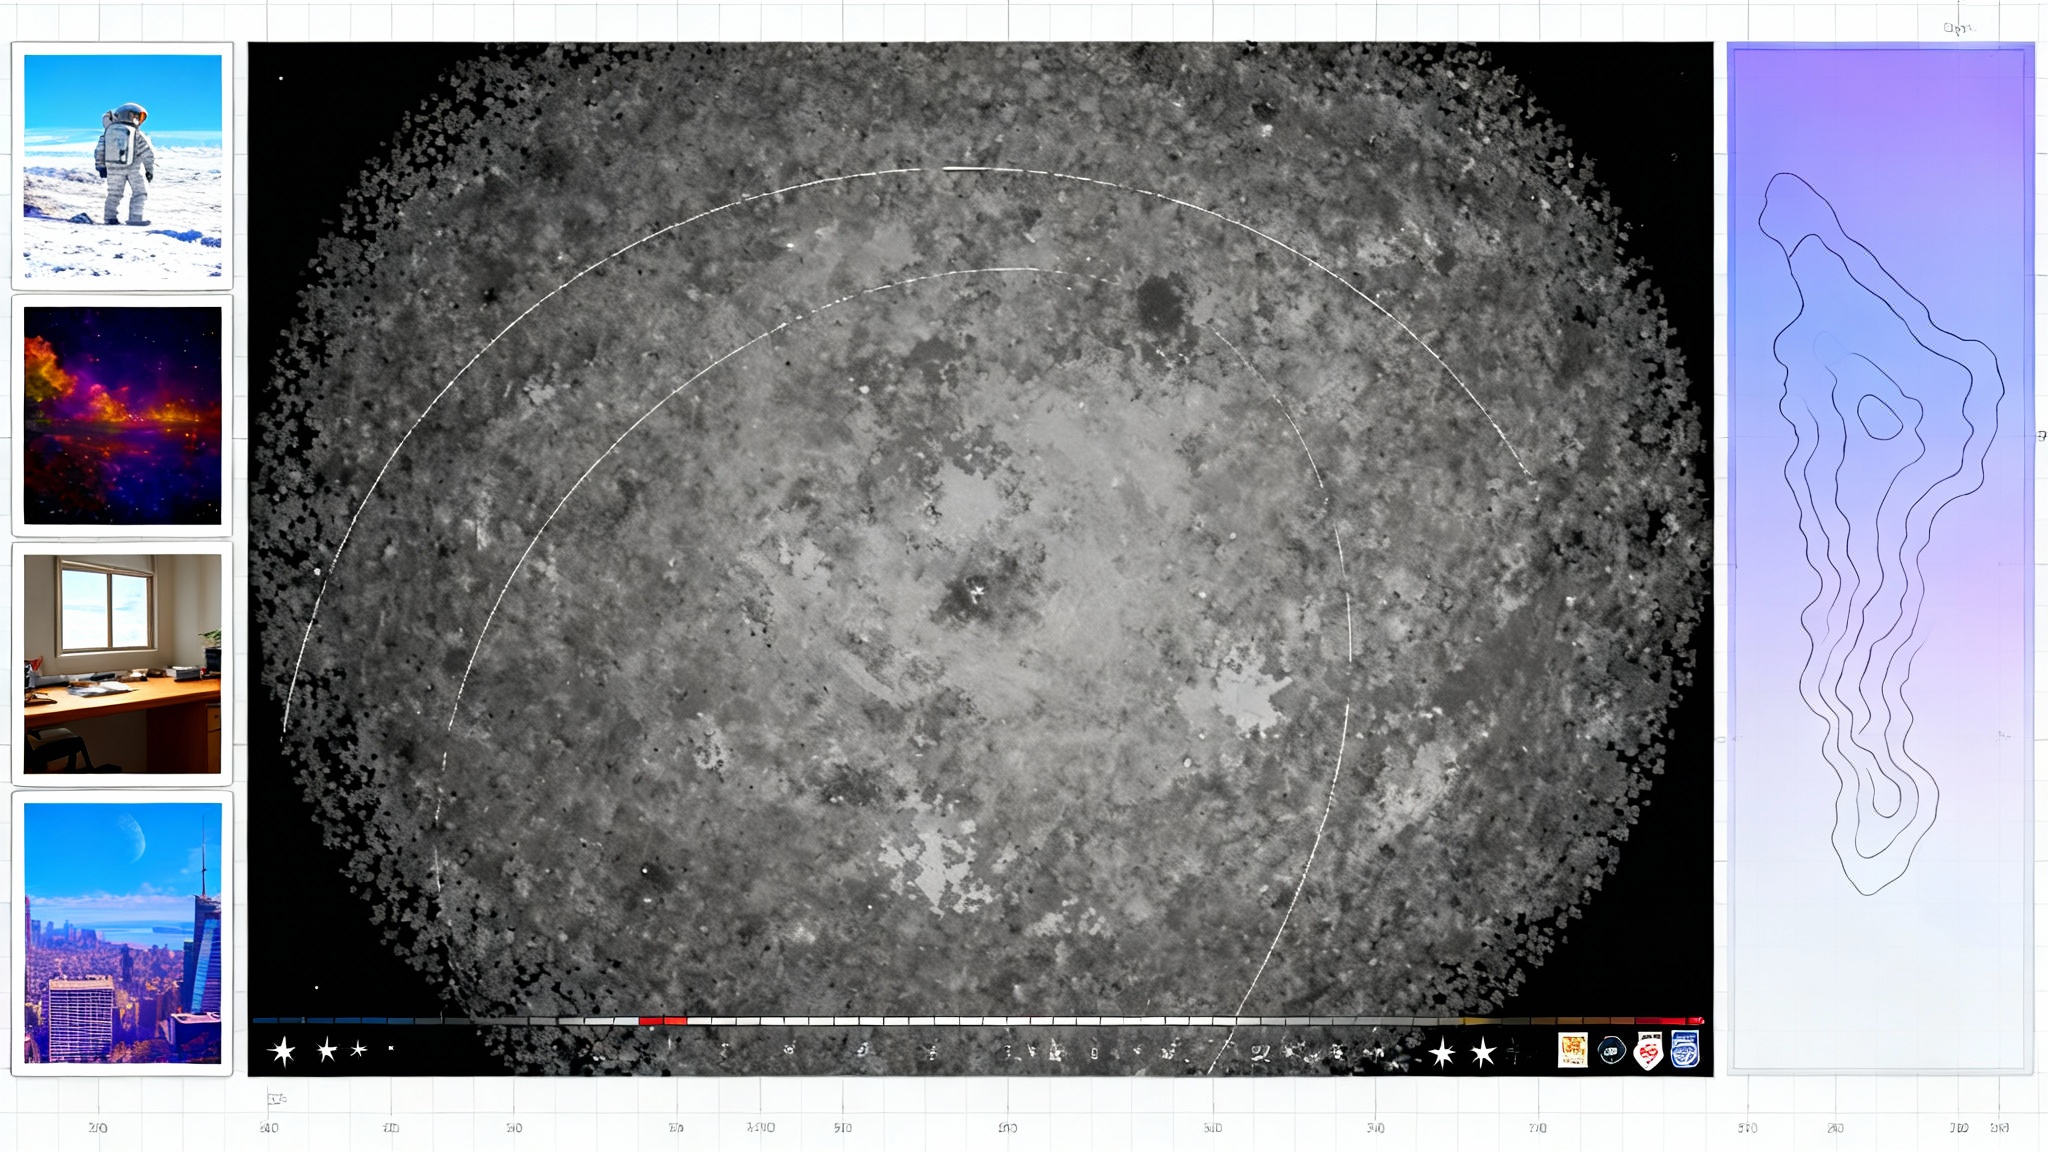
On March 19, 2025, the European Space Agency’s Euclid mission made good on a promise: a public Q1 data release that anyone can use without waiting for proprietary clocks or closed doors. Q1 covers 63 square degrees of sky and includes roughly 26 million detections, a scale that sounds abstract until you picture it as a city grid of galaxies. Each block holds faint shapes and colors that encode the pull of invisible mass and the stretching of spacetime. The result is less a snapshot than a starter map, and it is open. For the official description of what is in scope, see the Euclid Q1 dataset overview.
This is not the final cosmology catalog. That will take more time and calibration. But Q1 is enough to move from talking about Euclid to building with Euclid. It sets the pace for an eighteen month sprint toward the next two milestones: Q2 on June 24, 2026 and the first full Data Release, DR1, on October 21, 2026. If Q1 is the map’s legend and first tiles, Q2 and DR1 are the widening panorama that lets us test how much dark matter clumps, how fast structure grows, and how gravity behaves on cosmic scales. That open-map ethos echoes efforts like Rubin’s first images ignite a real-time sky and IMAP turns solar maximum into a map.
What is actually in Q1
Think of Q1 as three things packaged for immediate work: calibrated images, object catalogs, and quality scaffolding.
- Calibrated images: Euclid flies two instruments. VIS shoots sharp optical images through a broad visible filter, tuned for precise galaxy shapes. NISP supplies near infrared imaging in three filters and slitless spectroscopy that reads galaxy redshifts from their smeared rainbow traces. Q1 delivers processed images from these channels over 63 square degrees, with associated weight maps and masks so you know what parts are trustworthy at a glance.
- Object catalogs: The release includes source positions, fluxes, basic morphological descriptors, and flags that tell you whether a measurement is likely clean or compromised by neighbors, cosmic rays, or saturation. The catalogs bundle cross-identifiers across the Euclid bands so you can move smoothly between images and tables without hand stitching.
- Quality scaffolding: Alongside the science data sit the ingredients you need to make careful choices. Point spread function samples, masks for bright stars and detector artifacts, and astrometric and photometric calibration metadata all ship in Q1. They are the rails that keep early analyses on track.
None of this would matter if the data were trapped behind institutional walls. It is not. The Euclid Consortium built Q1 for immediate public use. That design choice changes who gets to participate and how fast the field moves, much like 3I/ATLAS makes a shared observatory.
Why Q1 matters right now for weak lensing
Weak gravitational lensing is the slight, coherent stretching of galaxy images by the gravitational fields of intervening matter. If you average the shapes of many galaxies, the random orientations cancel and the tiny shear pattern remains. That pattern maps invisible mass. With enough area and careful calibration, you can turn shear into statements about how much matter the universe holds and how clumpy it is.
Q1 does not yet provide the cosmology grade shear catalog that the headline analyses will rely on by DR1. What it does provide are the raw ingredients to build pilot mass maps, to stress test shape pipelines, and to learn the texture of Euclid’s systematics on real sky.
Here is what that looks like in practice:
- You select high signal to noise galaxies from the VIS catalog and apply basic star galaxy separation to avoid point sources.
- You measure shapes with a stable, well understood method, such as adaptive moments or forward modeling on postage stamps. The Euclid images are sharp, so even simple methods work surprisingly well over limited patches when you control systematics.
- You model and correct for the point spread function using the PSF samples that ship with Q1, then validate by checking that stellar shapes show no spurious shear.
- You convert the cleaned shear field into a two dimensional convergence map with a Kaiser Squires style inversion. On 1 to 5 degree patches, these maps already reveal the scaffolding of large scale structure.
These first pass maps are not for setting world records on cosmological parameters. They are for learning how Euclid behaves in your hands, for comparing different shape algorithms on the same sky, and for discovering where masks, dithers, and detector boundaries create subtle edges in your products. Every one of those lessons pays off when Q2 lands, and again when DR1 scales things by an order of magnitude.
Why Q1 matters for gravitational lens hunting
Strong gravitational lenses are the cosmic funhouse mirrors that occur when a massive foreground object sits along the line of sight to a distant galaxy or quasar. The background light is split into arcs, rings, and multiple images. Lenses are rare, but Euclid’s resolution and sky coverage are built to find them in bulk.
Finding them is now a game for everyone. You can do it by eye with good heuristics, or you can train a machine learning model to triage millions of candidates. Q1’s images and catalogs support both paths.
- Visual discovery: With VIS images as the base layer, faint blue arcs pop next to redder deflectors. That color contrast is natural in Euclid because the near infrared channels trace older stellar populations while the optical channel picks out star forming background galaxies. Simple color composites act like neon signs for lenses.
- Machine discovery: You can assemble training sets from Q1 itself. Start with simulated lenses injected into real Q1 backgrounds to teach the model what signal looks like. Blend in known lenses from pre-Euclid surveys to anchor the distribution. Then sweep the Q1 tiles with a classifier that promotes high confidence candidates to human review.
The payoff is immediate. Every new galaxy scale lens tightens our grip on galaxy mass profiles. Every new cluster lens maps dark matter on megaparsec scales and provides natural telescopes for the high redshift universe. And because Q1 is public, the best discoveries will come from many small teams rather than a few large ones.
Open access and the new time to discovery
Open data unlocks speed, but only if the work can be automated and shared. That is where modern analysis stacks and cloud workflows shrink time to discovery.
- Reproducible notebooks: Package your Q1 exploration in notebooks that pin library versions and document each choice. Students can rerun them on a laptop; collaborators can scale them on a cluster. A clear notebook is the bridge from curiosity to contribution.
- Scalable formats: Work with memory efficient tabular formats and chunked image reads so your scripts run quickly on modest machines. Build with parallel friendly patterns from the start so you can scale to the full sky later without rewriting everything.
- Shared models and benchmarks: Release trained models, not just papers. A small repository that includes data loaders, pre and post processing, and evaluation metrics lets others test a new idea in hours, not months.
The social side matters too. Open leaderboards for lens candidates, shared checklists for weak lensing systematics, and regular community sprints will turn Q1 into a teaching hospital for Euclid analysis. By the time Q2 and DR1 arrive, the community will have a library of vetted tools and a culture of quick, careful peer review.
For images, early science highlights, and mission context, read the Euclid Q1 press release.
What changes between Q1, Q2, and DR1
The three releases work like successive passes with a finer brush.
- Q1 is the on ramp. It is small enough to download and understand quickly, but large enough to represent the sky Euclid will see. Use it to validate pipelines, to build early mass maps, and to train and test lens finders.
- Q2, scheduled for June 24, 2026, expands area and depth while baking in lessons learned from Q1. Expect more uniform coverage and more polished calibrations. If Q1 is where you learn, Q2 is where you start scaling.
- DR1, scheduled for October 21, 2026, is the moment the cosmology grade catalogs appear. Shape measurements will have full calibration, photometric redshifts will be cross checked across the footprint, and spectroscopic products will anchor key subsamples. This is where parameter constraints and flagship science mature.
Another way to see it: Q1 asks questions, Q2 amplifies signal, DR1 closes loops.
A simple mental model for weak lensing and dark matter maps
If the universe were a rubber sheet, galaxies would be grains of sand sprinkled on top. Massive structures underneath would sag the sheet. Looking across the sheet, the grains look a little stretched where the sag is strongest. That stretch pattern reveals the hidden landscape.
Euclid’s VIS instrument tells us how each grain is stretched. The NISP filters tell us how far away the grains are, which is crucial because the amount of stretch depends on the distance between grain, dent, and observer. Turn shapes plus distances into a map, and you have a chart of dark matter that needs no light to shine. That is the power of weak lensing.
Strong lensing is when one dent is so deep that it creates mirror images of the same grain. These are less common, but they are bright billboards that often teach us more per object than weak lensing does per object. Euclid’s pairing of sharp images and wide area makes both channels work together.
Start now: a practical guide
You do not need a supercomputer to get started, and you do not need inside access. Here is a concrete plan you can follow this week.
- Get the data
- Visit the Q1 portal and choose one of the 63 square degree fields to keep your first experiment manageable. Pull the VIS coadds, the NISP imaging in the three filters, and the corresponding weight maps and masks. Fetch the object catalog that matches your field so you can work without running your own detection pipeline on day one.
- Explore the images
- Build quick color composites from VIS and NISP. Identify bright star masks and note where detector boundaries sit. Make a small gallery of interesting cutouts so you have a feel for real objects before you touch a line of modeling code.
- First weak lensing map
- Select galaxies with high signal to noise and reliable shape flags. Compute adaptive moments for each galaxy and correct for the point spread function using the provided PSF models. Bin your shear estimates on a grid and run a simple Kaiser Squires inversion to build a convergence map. Validate by checking that stars show no residual shear and that the B mode signal is small compared to the E mode. Document every cut and threshold.
- First lens finder
- Assemble a training set by injecting simulated arcs into Q1 backgrounds. Use color and curvature features to build a lightweight classifier that ranks cutouts by lens likelihood. Promote the top one thousand candidates for human inspection and keep a clean list with positions, estimated redshifts, and notes about environment.
- Share and pressure test
- Release a brief technical note with your method, your code, and your first catalog. Invite replication by specifying exact data products, file hashes, and seed values. Ask three explicit questions you want others to test, such as sensitivity to mask edges, to ensure the conversation stays concrete.
- Prepare for Q2 and DR1
- Write a short plan that lists what you will rerun and what you will rethink when the area doubles or the calibrations change. Tag your scripts by release so comparisons are easy. Build small dashboards that show key metrics over time, such as shear calibration factors and photo z residuals, so you will spot improvements and regressions at a glance.
Milestones to watch through 2026
- March 19, 2025: Q1 released. The first public tiles, catalogs, and calibration aids arrive, which means open season for pilot maps and lens discovery.
- June 24, 2026: Q2 scheduled. Expect more uniform coverage, better calibrations, and expanded products. Plan to scale your Q1 workflows rather than reinvent them.
- October 21, 2026: DR1 scheduled. Cosmology grade catalogs, end to end calibrations, and broad community analyses. This is where results start to set the field’s baselines for the decade.
What this acceleration means for cosmology
Two shifts matter most.
- Participation broadens. When data are open from day one, undergraduates, small departments, and independent researchers can jump in. That adds eyes on artifacts, creativity on methods, and new angles on old questions. Diversity of attack is not a slogan here; it is a throughput increase.
- Feedback loops tighten. Early lens catalogs and pilot shear maps sharpen instrument models and calibration strategies. That means by DR1 the mission has burned down more risk and harvested more wins than a closed pipeline would allow. The net result is not just faster papers; it is more reliable ones.
If you are looking for a role, pick one of three: builder, tester, or scout. Builders create and share tools. Testers replicate and stress those tools in new patches of sky. Scouts search for outliers and rare jewels that reveal where our models break. Q1 has room for all three.
The relay from Q1 to DR1
Q1’s real gift is that it turns everyone into a runner in a shared relay. The baton is a set of images, catalogs, and quality guides that you can grab today. Pass it forward as pipelines, models, and candidate lists. When Q2 arrives, pass again. When DR1 drops, finish a leg that only you could have run.
That is how a starter map becomes an atlas and how an atlas becomes knowledge. The dark universe will not light itself. We turn it into an open map by using it.
