IMAP lifts off to turn solar maximum into a live heliosphere map
Launched September 24, 2025, NASA’s IMAP is cruising to L1 to turn solar maximum into a live map of the heliosphere and deliver earlier, sharper space‑weather alerts for Artemis crews and satellites.
Launch morning, and a new kind of weather map
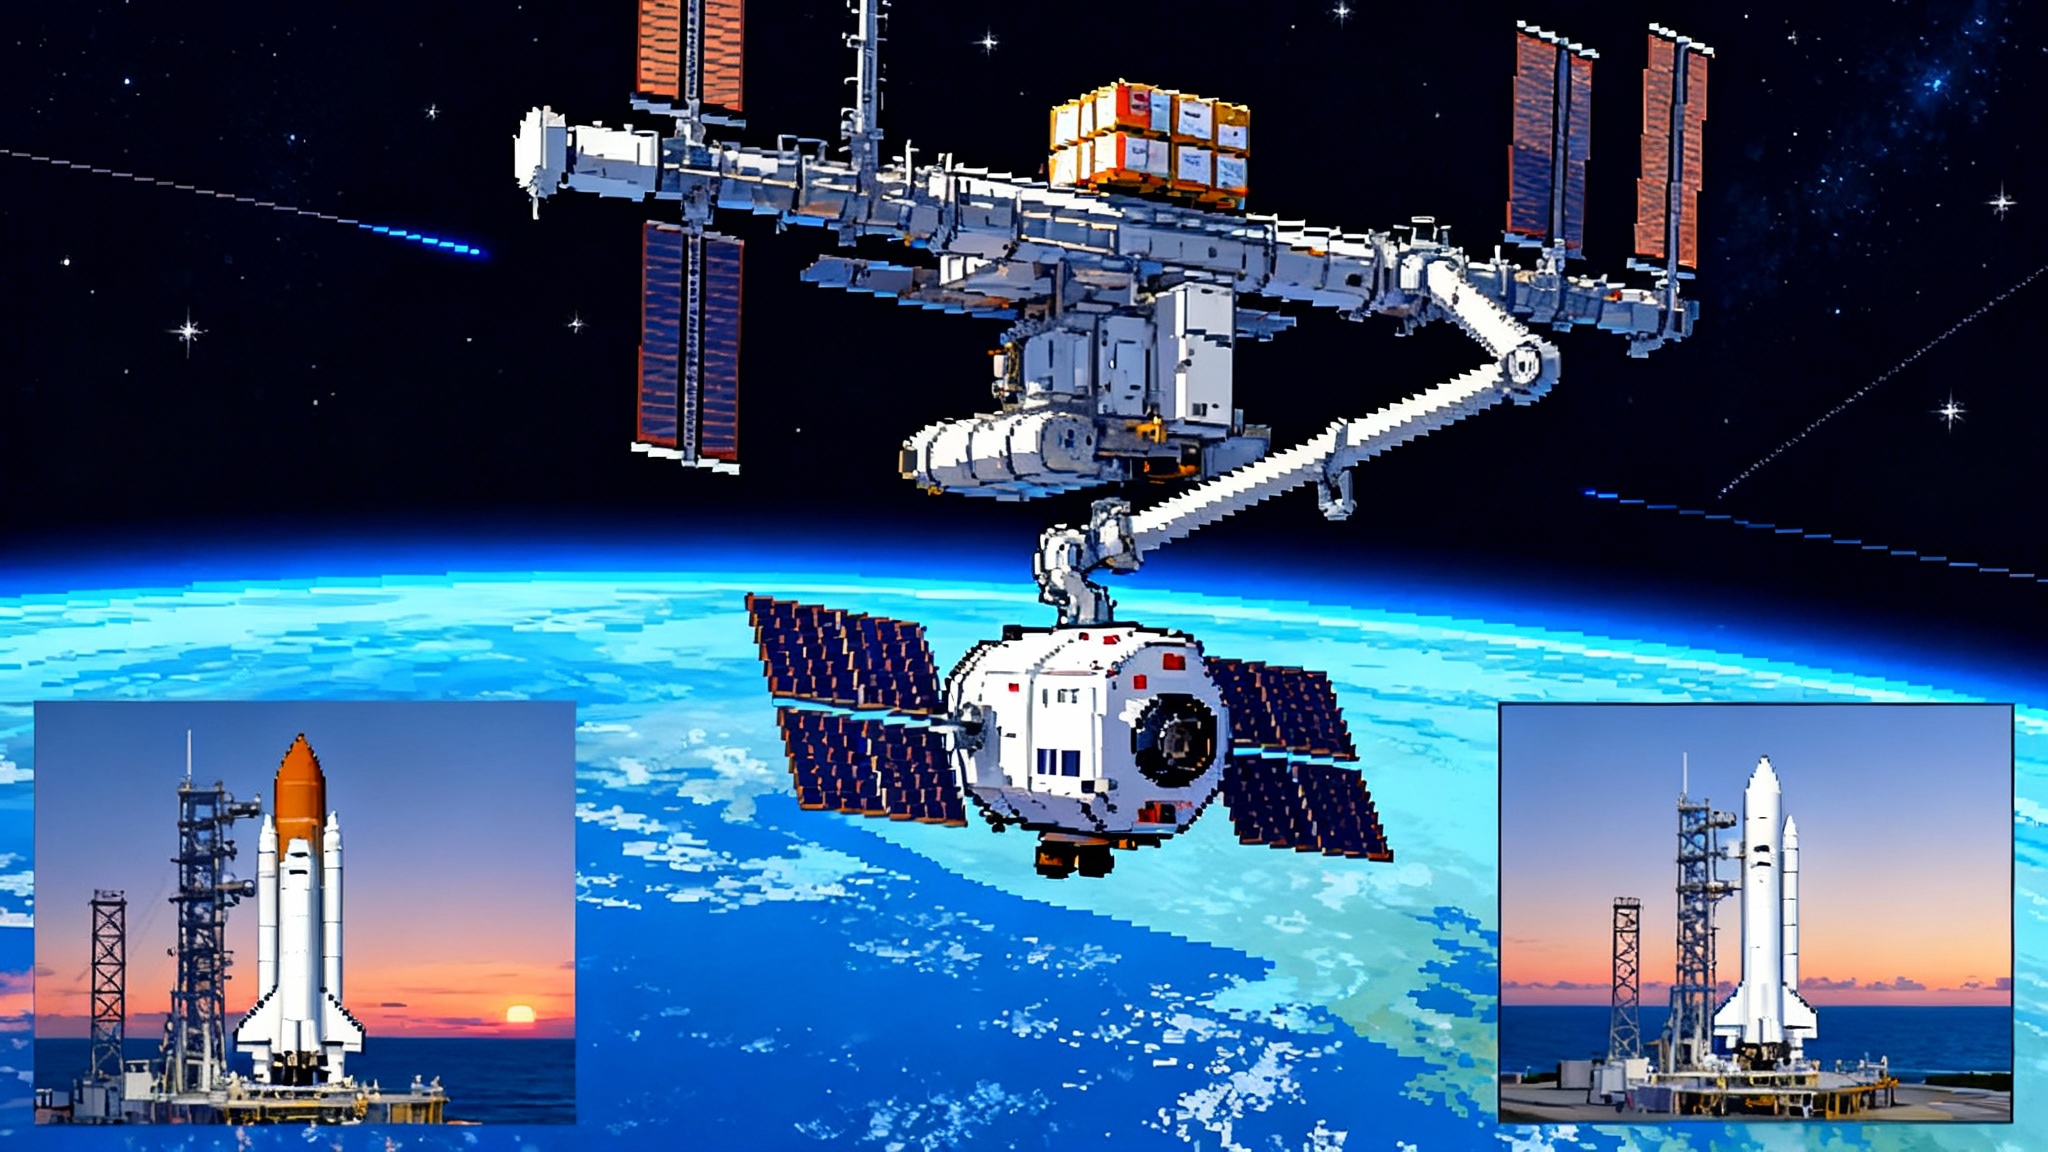
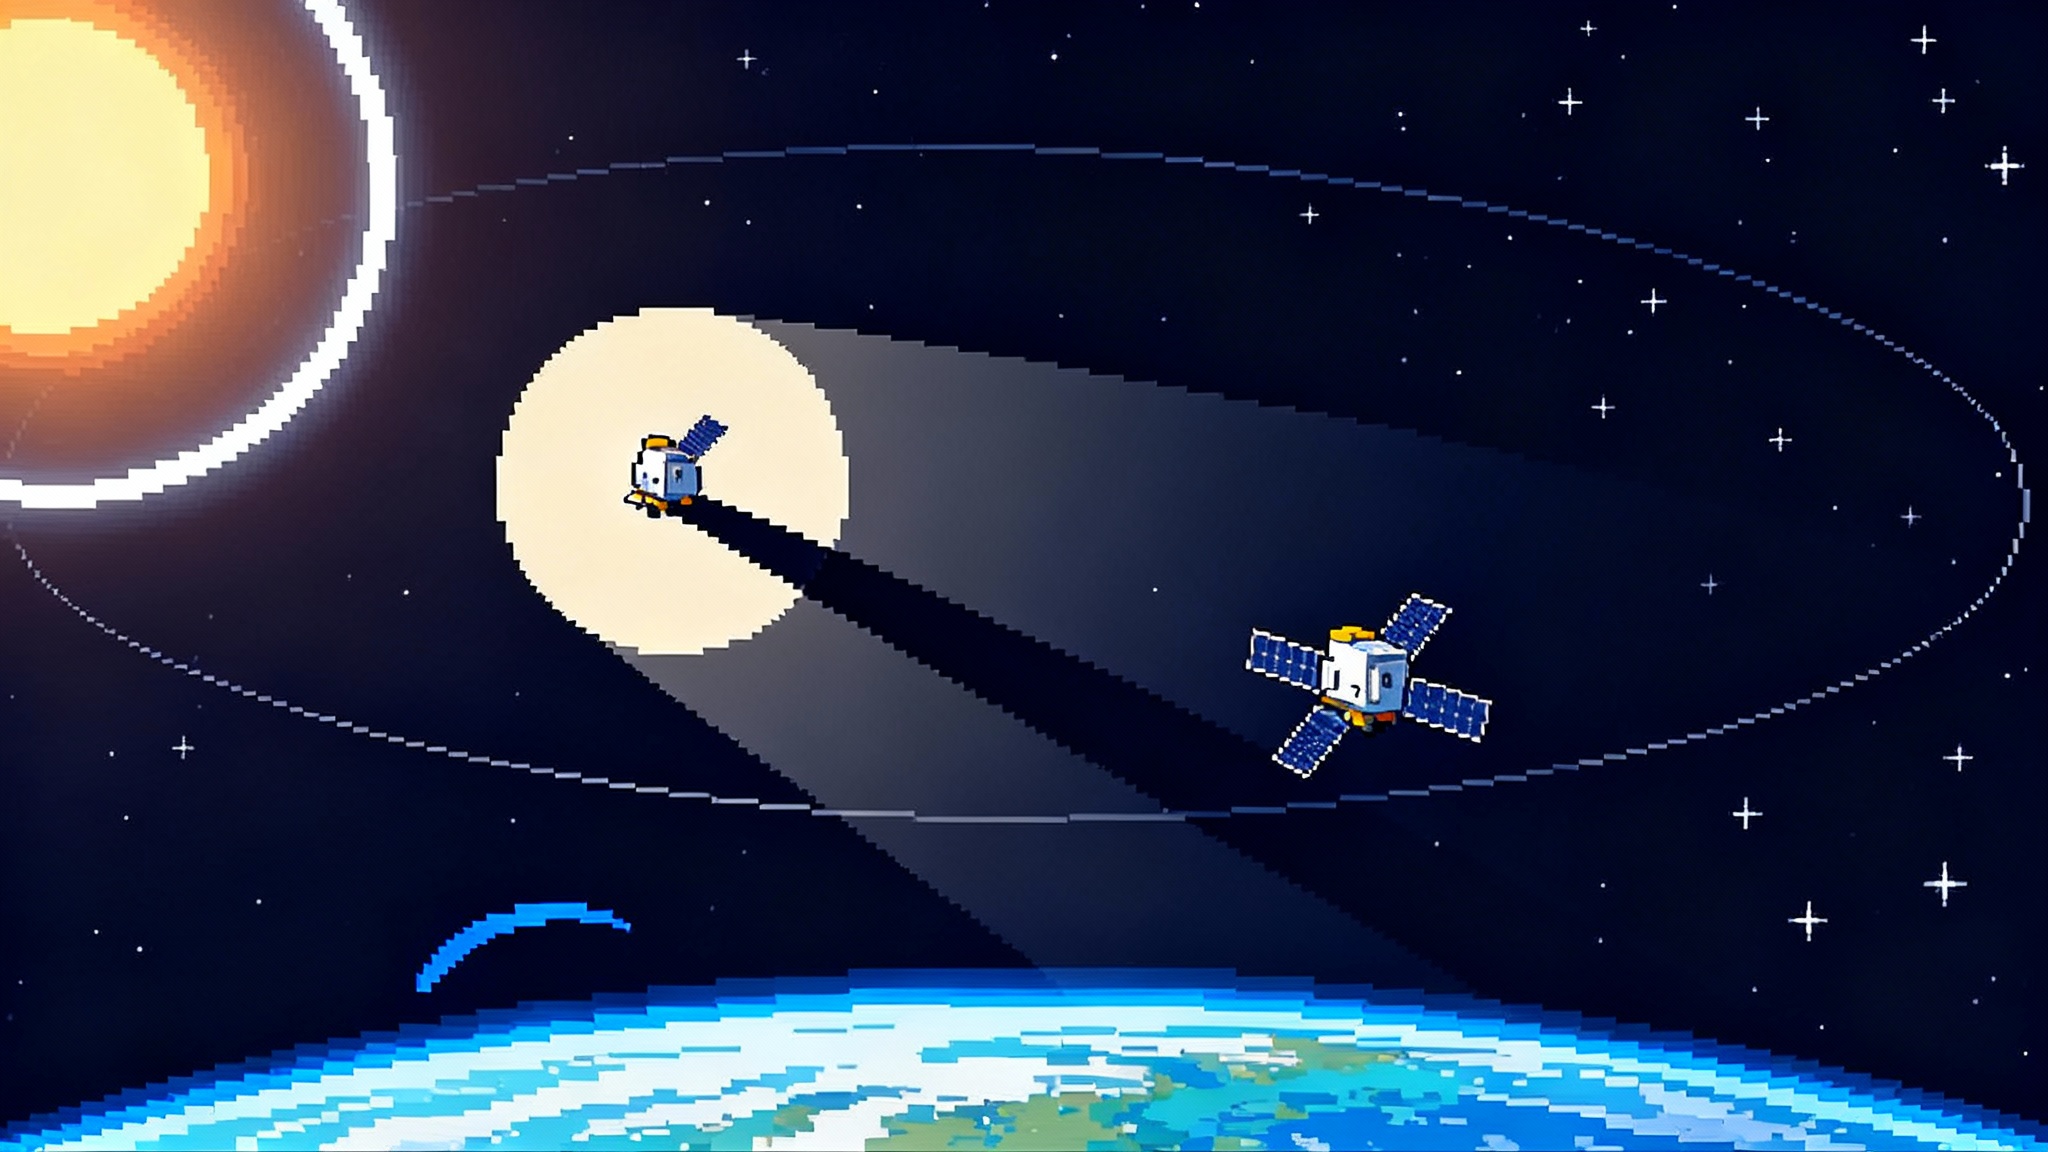
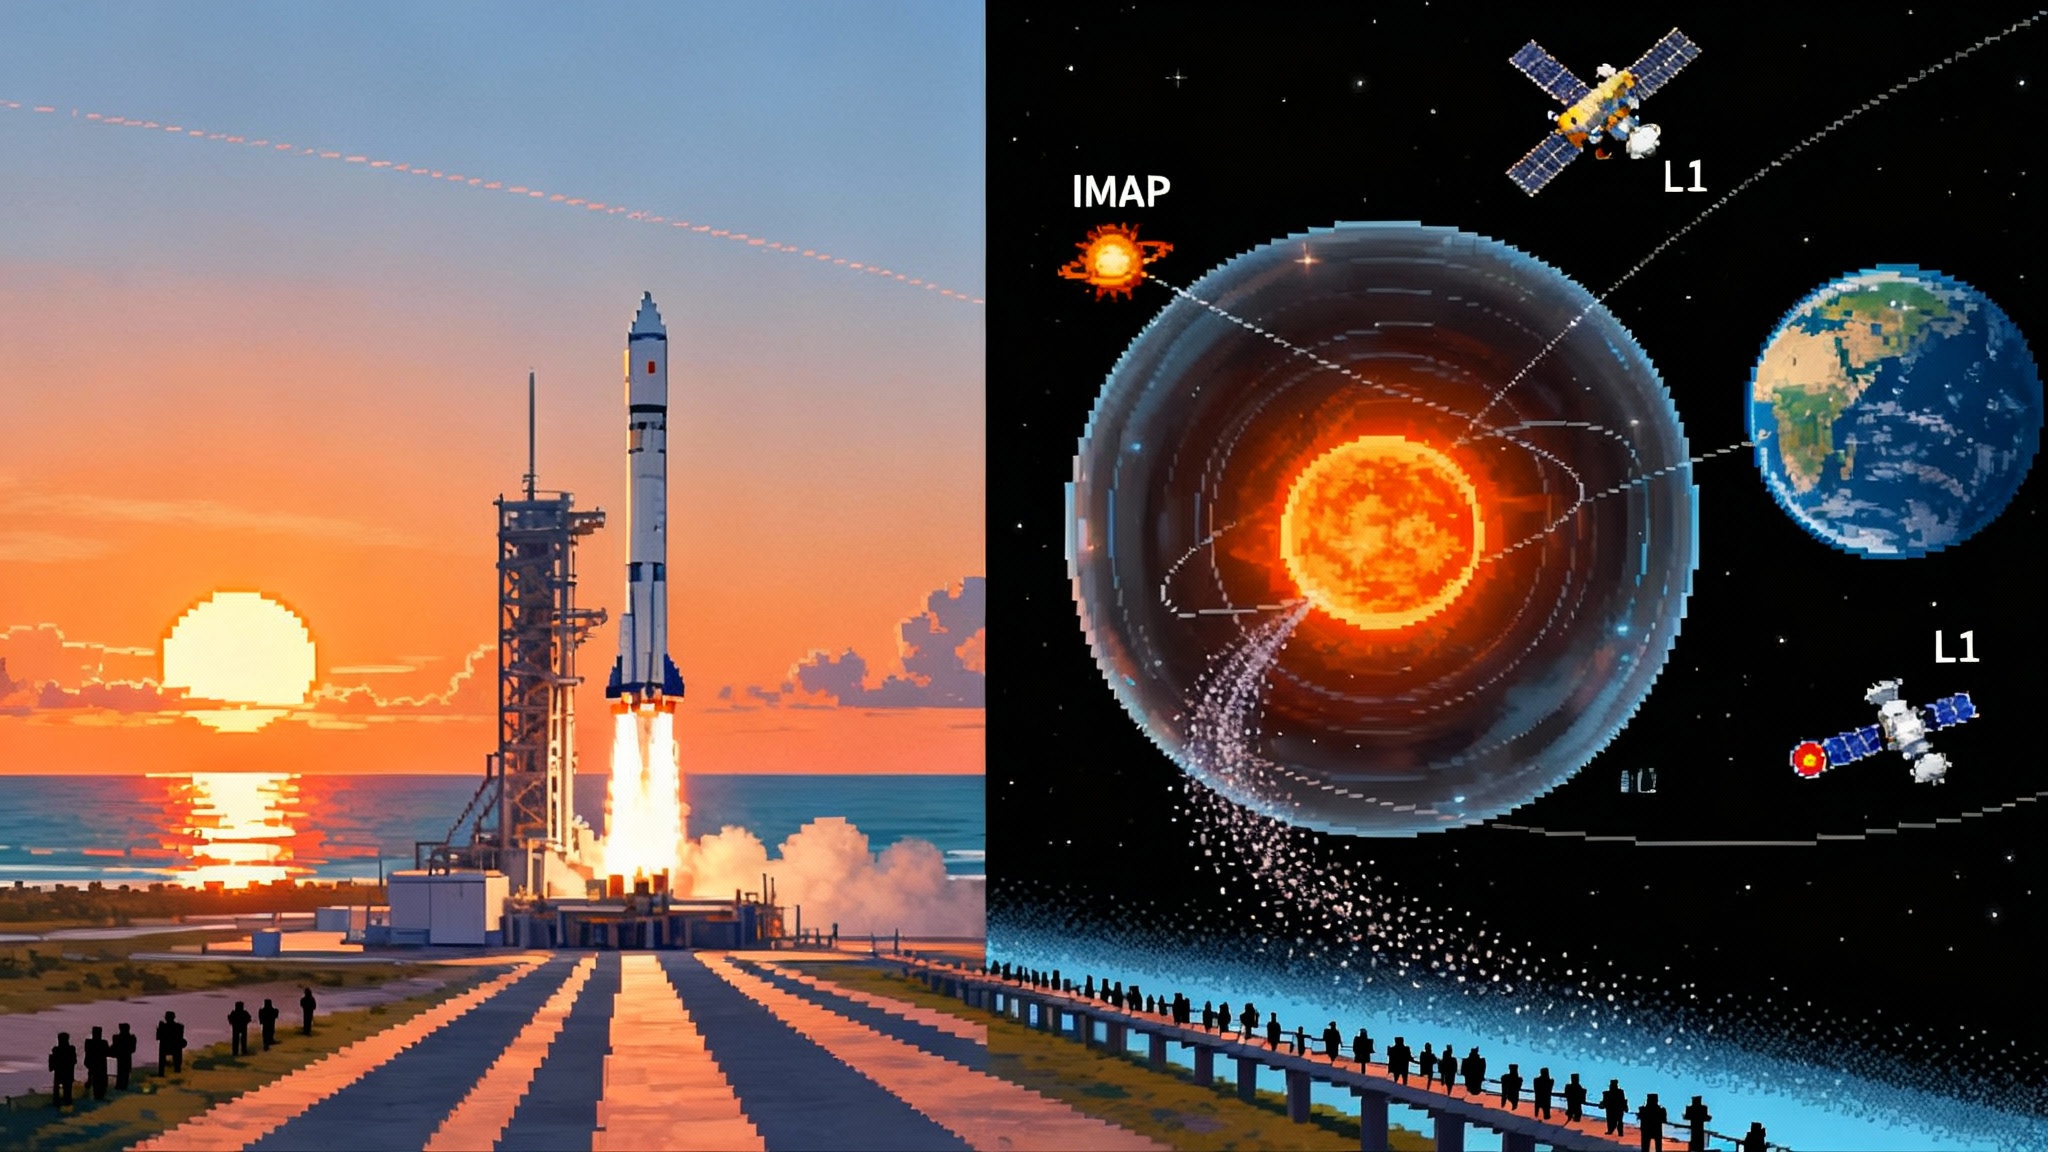
At 7:30 a.m. Eastern on September 24, 2025, a SpaceX Falcon 9 lifted NASA’s Interstellar Mapping and Acceleration Probe off the Florida coast. The destination is not a planet. It is a lookout point in empty space called L1, about one million miles sunward, where gravitational tugs balance into a steady perch. From there IMAP will begin turning solar maximum into a live map of our neighborhood’s invisible traffic: charged particles, neutral atoms, and the magnetic fields that herd them. NASA set the liftoff time for the three‑spacecraft stack that carried IMAP, NOAA’s SWFO‑L1 space weather sentinel, and the Carruthers Geocorona Observatory in a late‑September update, and the schedule held. NASA’s launch notice captured the stakes.
IMAP is built and operated by Johns Hopkins Applied Physics Laboratory with Princeton University leading the science team of 27 institutions. It spins once every 15 seconds like a lighthouse. Each spin sweeps ten instruments across the sky, turning incoming particles into pictures. Think of it as Doppler radar for the edge of the solar system. Where weather radar paints raindrops, IMAP paints atoms that were born at the border where the solar wind crashes into the gas between the stars.
IMAP will cruise for about three and a half months, reach L1 in January 2026, and begin science commissioning. That timing is perfect. Solar Cycle 25 is peaking. Bursty space weather makes for rich data and real operational value right away.
What IMAP actually measures
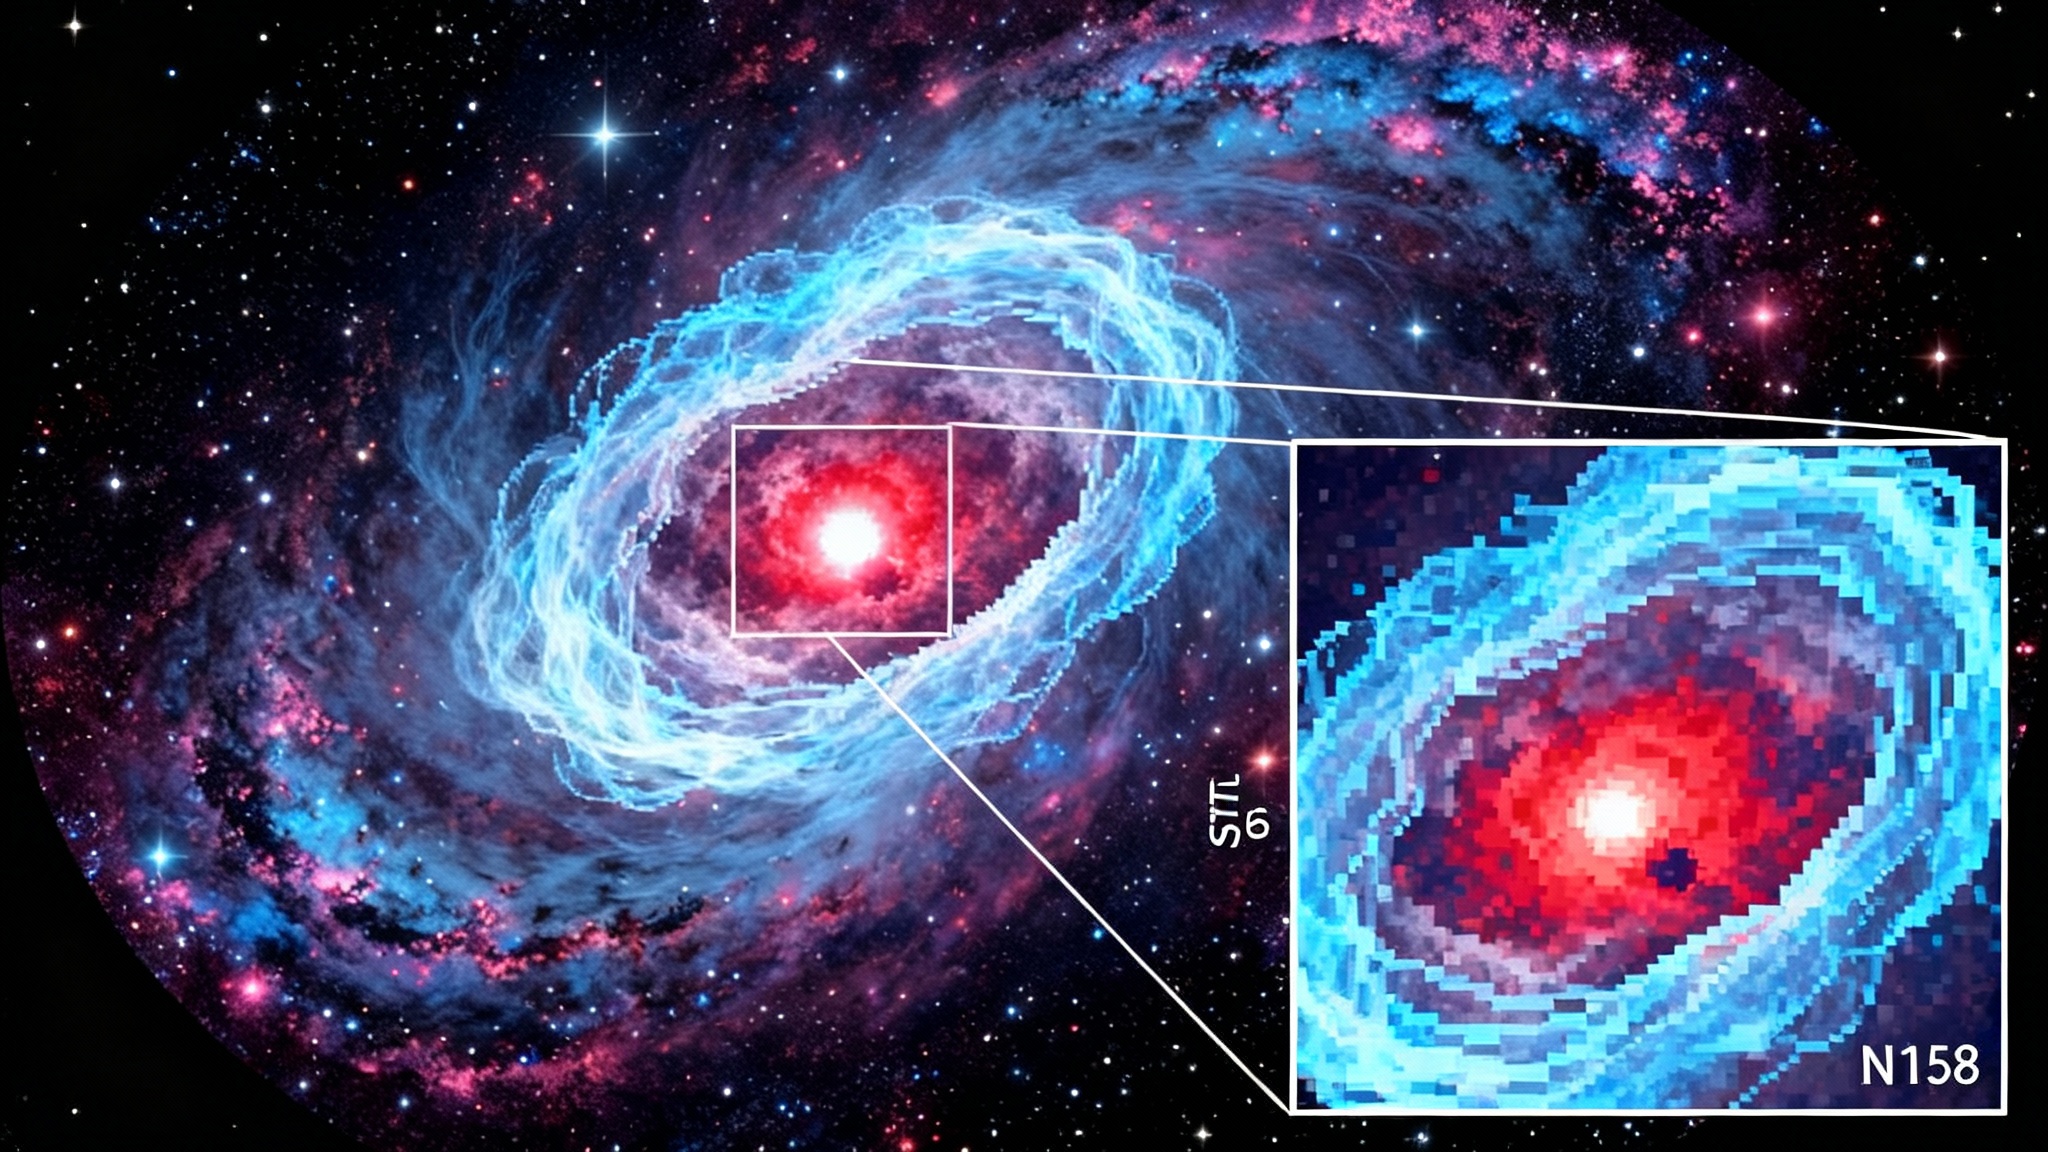
Our solar system is wrapped in the heliosphere, a bubble inflated by the solar wind. Where that wind slows against the local interstellar medium, there is a complex boundary region with shocks, turbulent layers, and a final transition called the heliopause. Voyager 1 and Voyager 2 crossed it years ago in different directions and at different distances, which told us the bubble is lumpy and alive.
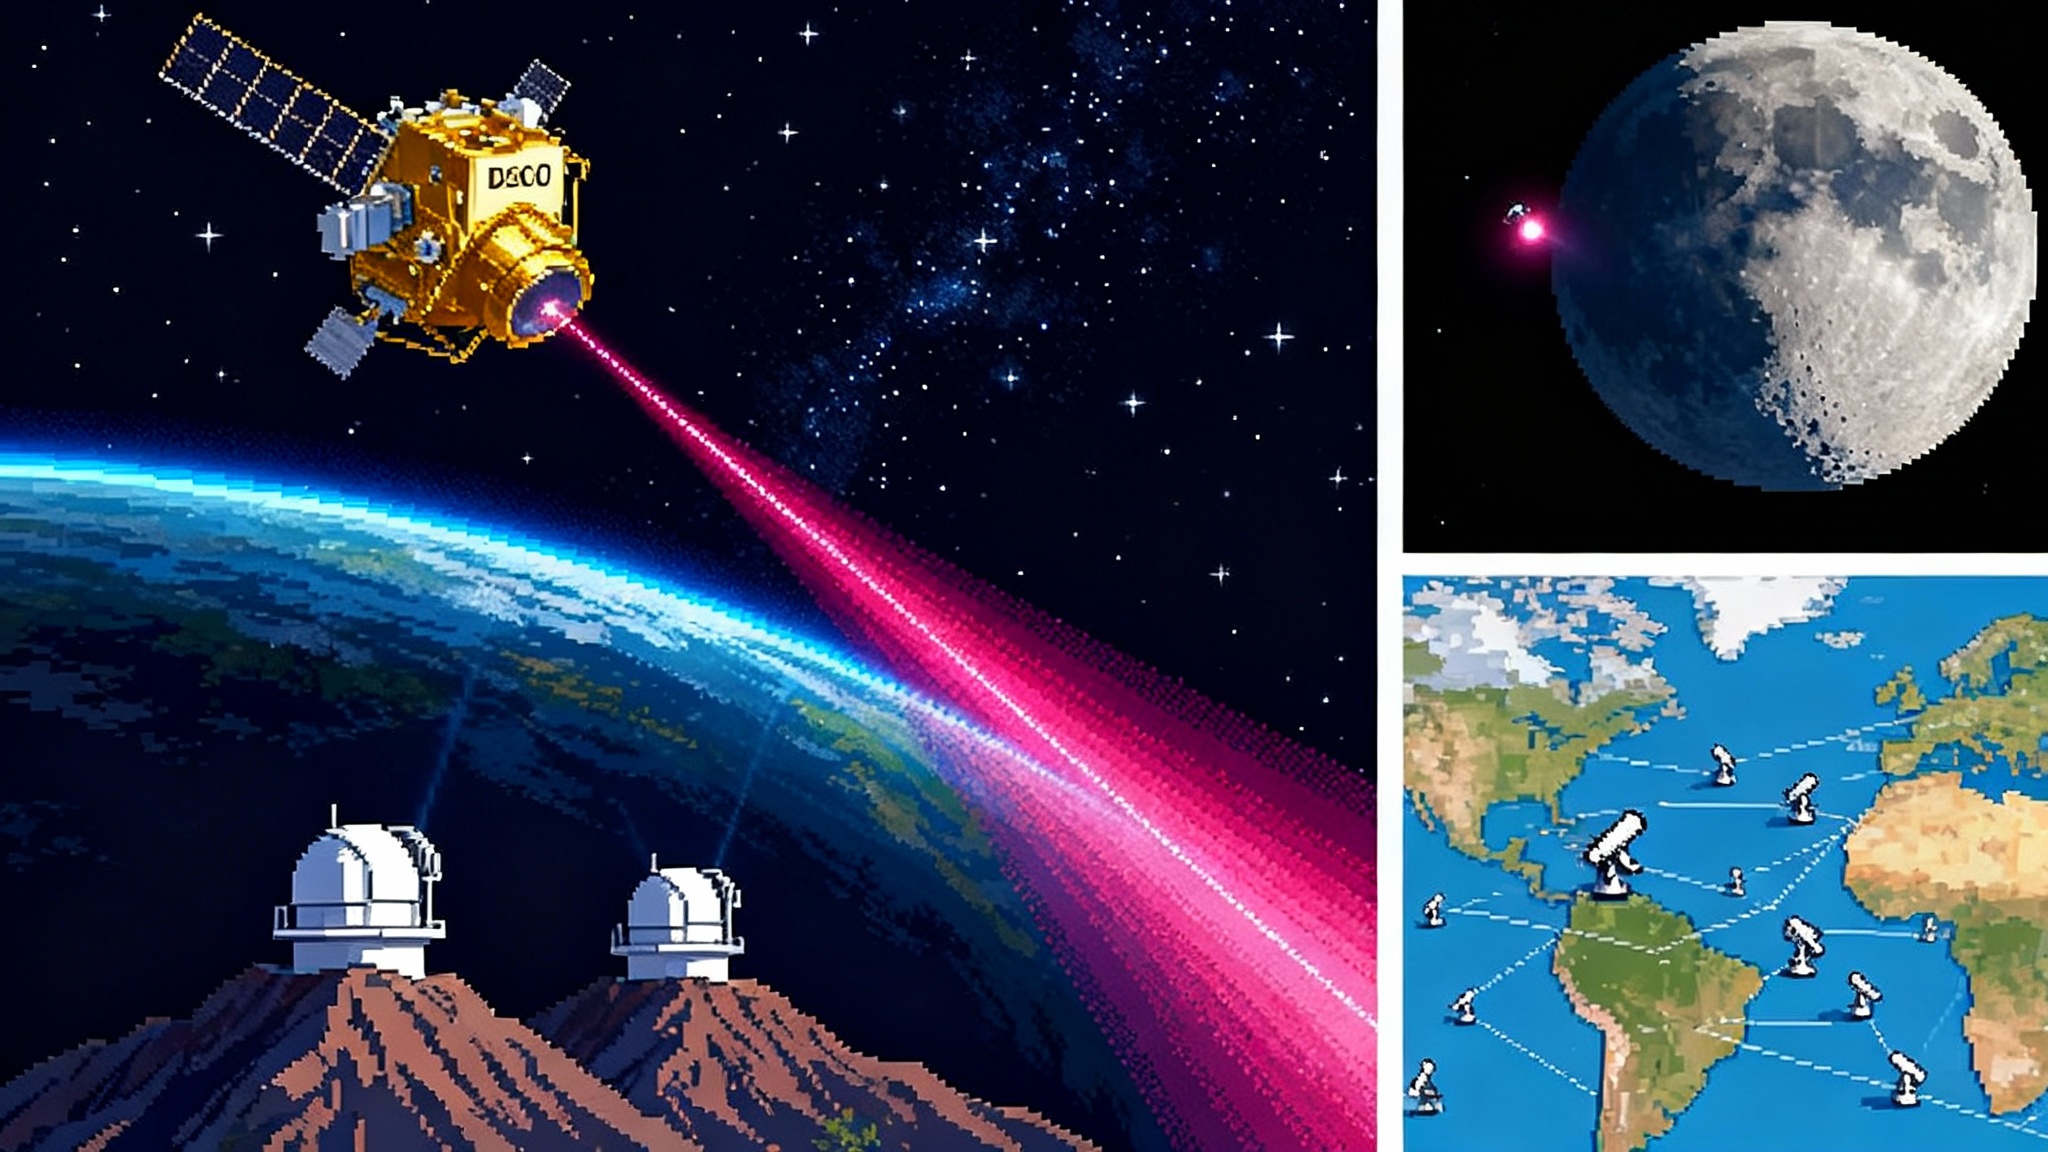
IMAP turns that boundary into a live sky map using energetic neutral atoms, or ENAs. These are the sneaky messengers of the heliosphere. When a charged particle steals an electron from a neutral atom near the boundary, it becomes neutral and can fly in a straight line. IMAP’s ENA cameras catch these straight‑line travelers and reconstruct where they came from, much like a pinhole camera reconstructs a scene from light rays.
That is the cartography part. The acceleration part comes from instruments that count and characterize the charged particles closer to home. Together, the package can answer questions that have hovered since NASA’s earlier Interstellar Boundary Explorer first revealed a mysterious bright ribbon across the sky. Is the heliosphere shaped like a windblown comet with a long tail, a stubby bubble, or something more like a croissant pinched by magnetic forces? Does its size breathe with the solar cycle by several astronomical units, or by tens? Which regions preferentially accelerate particles that can pose a radiation risk to astronauts and electronics?
IMAP’s instrument suite is built for that. Three imagers cover low, high, and ultra‑high energy neutrals. A magnetometer sits on a boom to measure the local magnetic field at L1. Ion and electron sensors track everything from placid solar wind to storm‑driven energetic particles. A dust sensor samples grains flowing in from interstellar space. GLOWS, built by the Space Research Center of the Polish Academy of Sciences, reads the ghostly ultraviolet helioglow that traces the inbound stream of interstellar hydrogen. Los Alamos National Laboratory provides the Solar Wind Electron instrument. Southwest Research Institute leads the Compact Dual Ion Composition Experiment. It is a well‑rounded kit designed to turn particle physics into a map you can use.
A three‑craft triangulation that upgrades lead time
IMAP alone is powerful. IMAP paired with two other frontline missions becomes a system. NASA’s Parker Solar Probe skims the inner atmosphere of the Sun, returning measurements of the raw solar wind before it is mixed and diffused. Europe’s Solar Orbiter, working with NASA, now tilts out of the ecliptic to see the Sun’s poles and the far‑side source regions of eruptions. That polar view began yielding firsts in 2025, and its scientific brief is clear. Solar Orbiter’s mission overview lays out how high‑latitude vantage changes what we can predict.
Together these three machines form a triangulation grid for space weather. Parker gives context close to the source. Solar Orbiter connects eruptions to their polar magnetic roots and captures off‑equator events we used to miss. IMAP watches what arrives at Earth’s doorstep and at the heliospheric boundary. Add NOAA’s SWFO‑L1 in the same orbital neighborhood and you get a dedicated operational beacon that feeds directly to NOAA’s Space Weather Prediction Center while IMAP feeds research‑grade particle maps.
For practical forecasting this matters in three ways:
-
Earlier hints from the Sun. Parker Solar Probe sees the waves, switchbacks, and fine structure of the solar wind that seed shocks and particle storms. Solar Orbiter images the erupting regions and tracks magnetic connectivity to Earth’s orbit. These upstream cues, when assimilated into forecast models, can move early alerts forward by meaningful minutes to hours.
-
Clearer discrimination between false alarms and real threats. IMAP’s particle spectrometers at L1 will watch for the first rise in solar energetic proton flux and the arrival of shock‑driven enhancements. This lets forecasters tell apart a fast but harmless streamer from a slow, mass‑loaded coronal mass ejection that packs a strong magnetic field.
-
Better error bars on arrival and severity. The worst satellite safing decisions are unnecessary ones. By fusing upstream imagery, in situ turbulence signatures, and L1 particle spectra, models can cut both late alarms and false positives. That directly reduces commercial losses from unnecessary safe modes and power‑grid deratings.
NASA expects IMAP to enable roughly half‑hour radiation warnings for hazardous particle events near Earth when conditions align, which is a crucial floor for astronaut safety. With Parker and Solar Orbiter providing upstream context, the ceiling can be higher during well‑connected events where magnetic field lines guide particles efficiently toward Earth. The result is not just more warnings. It is better triage.
What this means for Artemis crews and satellites
The most consequential users are people. Artemis crews headed to the Moon will travel outside Earth’s protective magnetic cocoon for days. In that environment, a bad burst of solar energetic protons is not an inconvenience. It is a mission threat. Onboard shelter mass in Orion and at Gateway buys time if crews can get the warning. For background on Gateway logistics and readiness, see how HTV‑X1 sets sights on Gateway.
Here is what the new toolchain enables in concrete terms:
-
EVA scheduling that respects particle weather. Mission planners can schedule lunar surface outings and deep‑space work periods around forecast quiet windows informed by Parker’s source imaging, Solar Orbiter’s polar context, and IMAP’s rising particle flux at L1. The rule becomes simple. If L1 counts or upstream proxies cross a threshold, suit‑ups wait.
-
Staged shelter drills with real numbers. When IMAP detects a sustained rise in high‑energy protons, controllers can call for a pre‑planned shelter‑in‑place inside Orion’s mass‑rich stowage area. Practice today should assume a 30 to 60 minute alert path. That fits inside communications cycles and crew timelines.
-
Smarter spacecraft safing. Commercial satellite operators live with a blunt playbook. If Kp indices or L1 plasma parameters spike, flip into safe mode and pray the batteries hold. With IMAP’s spectra and SWFO‑L1’s continuous operations feed, operators can use tailored thresholds by orbit class and hardware generation. High inclination Earth observation satellites can flip detector lids or rotate solar arrays to reduce cross section, while geostationary platforms might selectively power down sensitive transponders. That is less revenue lost for the same level of risk reduction.
-
Realistic design targets for the next builds. Spacecraft that launch in 2027 and beyond can use IMAP’s particle distributions to tune shielding, component selection, and error‑correction strategies. Vendors can trade mass against failure rates with current spectra rather than decade‑old climatology.
Redrawing the edge of home
Voyager 1 crossed the heliopause at roughly 121 astronomical units in 2012. Voyager 2 crossed at about 119 astronomical units in 2018. Those crossings were snapshots on two paths. IMAP will provide a moving picture of the whole boundary. The team will compare today’s ENA sky with the legacy maps from IBEX and from Cassini’s ENA work to see how the heliosphere’s edge shifted through this solar cycle.
One likely outcome is a recalibrated distance and shape for the termination shock and heliopause in multiple directions. If the local interstellar magnetic field presses more strongly on one side, IMAP’s maps should show brighter ENA fluxes there and a shifted boundary. If the solar wind’s pressure at the poles differs from the equatorial outflow, Solar Orbiter’s polar measurements will help interpret the pattern. The croissant versus comet debate may settle into a third picture. A bubble with magnetically pinched lobes that puff and relax as the Sun’s activity breathes.
This is not academic. The heliosphere’s size and shape set the flux of galactic cosmic rays that reach Earth and any crew outside its inner magnetic shield. If IMAP shows the boundary shrinks more during certain phases, deep space mission planners can aim outgoing cruises for less exposed seasons or budget more shielding when the bubble is thin. For a broader view of time‑domain observing turning into operations, see Rubin’s first images ignite.
Ground‑truth for the next leap outward
Navigation in deep space depends on stable reference frames and honest environmental models. An interstellar precursor mission needs both. Whether the first probe beyond 200 astronomical units flies as a government flagship in the 2030s or as a private demonstrator sooner, IMAP can provide the tables that mission designers crave.
-
A particle background atlas. Star trackers and ultraviolet sensors need clean skies. IMAP’s ENA maps and helioglow measurements will identify sky regions with higher neutral atom backgrounds and ultraviolet scatter. That lets designers choose pointing strategies and detector thresholds that keep false matches low.
-
A dust and micro‑meteoroid forecast. The Interstellar Dust Experiment and GLOWS will refine flow direction and size distribution for incoming grains. That informs shield placement and cruise attitudes for long‑duration probes that cannot afford heavy Whipple shields on every side.
-
A local interstellar medium state estimate. The exact density, temperature, and magnetic field orientation around our heliosphere change slowly. IMAP’s composition and field measurements can be assimilated into models that predict how the boundary will look when a mission arrives years later. This is the difference between flying blind and flying with a chart drawn from the same season.
-
A radiation exposure baseline. Human exploration architectures that contemplate long sorties beyond Earth’s magnetosphere can use IMAP’s spectra to validate the margins in their radiation design models. That includes storm shelter mass in transit vehicles, regolith vault concepts on the Moon, and error‑correction budgets for avionics. For comms and navigation resilience, also see Deep‑space laser links arrive.
What to watch between now and first maps
-
The L1 insertion and spin‑up in January 2026. Expect a sequence of burns and a quiet verification period. The spacecraft should confirm spin rate, check out pointing, and begin instrument calibrations.
-
Early ENA sky maps in spring 2026. Initial products will be low in counts and high in calibration value. The trick with ENAs is patience. Counts build over weeks to months. Resolution and confidence grow with them.
-
Cross‑mission campaigns. When Parker flies through a bursty solar wind stream and Solar Orbiter watches the source region from above the solar equator, the team can task IMAP to favor certain look directions. Those triads deliver the best science and the most actionable operational insights.
-
SWFO‑L1’s handoff to operations. Once NOAA’s spacecraft settles into routine service, forecast centers will start to blend SWFO and IMAP data streams. This is where commercial satellite operators should engage to shape alert thresholds that match their hardware.
For industry and mission planners
If you run a fleet of satellites, do three things now:
-
Engage with NOAA’s Space Weather Prediction Center about how IMAP and SWFO‑L1 data will appear in products you already use. Ask for trial alerts keyed to energetic proton thresholds that match your hardware sensitivity.
-
With your avionics vendors, update your on‑orbit safing logic to include particle spectra where available, not just geomagnetic indices or total electron content. Test scenarios that distinguish brief spikes from sustained events.
-
Budget time in your operations plans for calibration periods in early 2026. The first IMAP data releases will evolve fast. You want your teams ready to use them when thresholds get refined.
If you are on an Artemis team, practice shelter‑in‑place drills with a 30 to 60 minute warning timeline. Verify that your communications and procedure chains can compress to that window. The procedures should be as crisp as a lightning hold on a launch pad.
If you design future deep space missions, build your radiation and dust models with placeholders for IMAP updates. Plan to refresh those inputs when the first sky maps and composition tables arrive. You will reduce mass and risk with current numbers rather than conservative guesswork.
The bigger picture
A decade ago, heliophysics relied on one‑off encounters and a handful of monitors. Today it looks more like a network. Parker Solar Probe samples the young solar wind. Solar Orbiter watches polar magnetic roots during solar maximum. IMAP converts particle physics into an all‑sky survey from our gateway at L1 and turns that survey into warnings, models, and navigation tables.
Solar maximum is noisy. In 2025, that noise becomes data. IMAP’s maps will reveal how our bubble breathes, how dangerous particles get their speed, and how we can live and work beyond Earth with more confidence. When the first interstellar precursor missions push outward later this decade and the next, they will not be guessing about the neighborhood they are leaving. They will be flying with a chart drawn in real time by a spinning cartographer one million miles from home.