Speed to Power: Washington’s fast track to wire the AI grid
DOE just launched Speed to Power to accelerate transmission and generation projects for the AI era. We break down how it fits with FERC’s 1920 series, state siting rules, and utility procurement, plus the winners, losers, and 2030 outlook.
The new fast track out of Washington
The U.S. Department of Energy on September 18 launched Speed to Power, a federal push to identify and accelerate multi‑gigawatt transmission and power plant projects that can come online quickly enough to meet surging electricity demand from AI data centers, reindustrialization, and electrification. The program opens a channel for utilities, RTOs, and developers to surface projects that are permit‑ready or can be made so with federal coordination and financing tools, and it aims to cut years off typical timelines by aligning agencies and tapping existing authorities. Think of it as a triage tent for the grid: move shovel‑ready work to the front of the line, unblock chokepoints, and pair projects with the right capital stack. DOE’s Speed to Power announcement sets the tone and the clock.
What makes this interesting is not that Washington wants faster wires and megawatts. It is that DOE is explicitly tying grid speed to AI competitiveness and inviting a national pipeline inventory. That opens the door to pragmatic choices about sequence and location: which 500 kV line actually unlocks the most near‑term capacity, which retiring plant site can host a quick gas repower with CCS‑ready interconnections, which nuclear uprates can be booked by 2028 rather than 2033. Speed to Power is not a silver bullet, but it can be a forcing function.
How DOE’s sprint aligns with FERC’s 1920 series
Speed alone will not fix planning. That is where FERC’s Order No. 1920 and the follow‑on Orders 1920‑A and 1920‑B matter. The 1920 series requires transmission providers to undertake long‑term, scenario‑based regional planning over at least a 20‑year horizon, with clearer cost allocation frameworks and a stronger formal role for states in shaping scenarios and cost shares. The compliance clock started in 2024 and continued through 2025, meaning RTOs and transmission owners are now standing up processes that will govern which lines make it into portfolios and who pays. FERC’s own explainer on Order 1920 and its rehearings highlights the intent: pick least‑regrets portfolios earlier, cost‑share more predictably, and right‑size replacements rather than perpetually patching.
Where do they collide or align?
- Alignment: Speed to Power can help lines and plants that are already inside, or adjacent to, 1920‑compliant regional plans jump the queue on federal coordination and financing. If a project sits in an approved long‑term plan with benefit‑cost analysis and state engagement, it is far more bankable and defensible.
- Potential friction: The 1920 series elevates state roles in planning and cost allocation. That is great for legitimacy, but it can extend timelines if consensus drags. DOE’s sprint wants to compress time. The practical answer is to prioritize projects with multi‑state alignment already in hand, and to use 1920’s right‑sizing provisions when replacing aging lines to avoid a second siting process.
- Hand‑off problem: FERC plans; states site. DOE can coordinate federal permits and capital, but it does not preempt state siting. Backstop siting under Federal Power Act section 216 still depends on DOE designating national interest corridors and on specific conditions. That means Speed to Power’s fastest wins will come from projects that do not need novel corridor authority at all.
State siting authority and the real gatekeepers
In most of the country, states control transmission siting and utility procurement. Order 1920 does not change that. It formalizes planning and cost allocation; it does not grant federal bulldozers. So the decisive variables are:
- Whether a line already has in‑state certificates or is replacing existing infrastructure along an established right‑of‑way.
- Whether governors and public utility commissions are aligned on near‑term load growth assumptions and are willing to let utilities carry steel‑in‑the‑ground risk ahead of guaranteed demand.
- Whether eminent domain fights are likely or avoidable through route choices and community benefits.
Speed to Power can help with interagency federal permits, financing (e.g., federal loans or purchase commitments for transmission capacity), and sequencing. It cannot conjure a route through three unwilling states.
Utility procurement: what gets chosen when the clock is ticking
Vertically integrated utilities across the Southeast and much of the West still build to integrated resource plans. In those regimes, fast procurement typically favors:
- 4 to 8‑hour batteries for peaking and contingency coverage.
- Flexible gas capacity with firm fuel and fast‑start characteristics, sited on brownfields with interconnections and water rights.
- Life‑extension and uprates at existing nuclear units where turbine and thermal margins allow capacity increases by 2028‑2030.
- Targeted transmission that unlocks trapped generation or connects new load campuses to multiple substations.
In RTO regions with capacity markets, recent auction outcomes and scarcity conditions are already signaling value for fast‑responding capacity and deliverability. Pair that with Speed to Power’s triage and the near‑term winners look familiar.
Winners and losers in a Speed to Power world
Winners
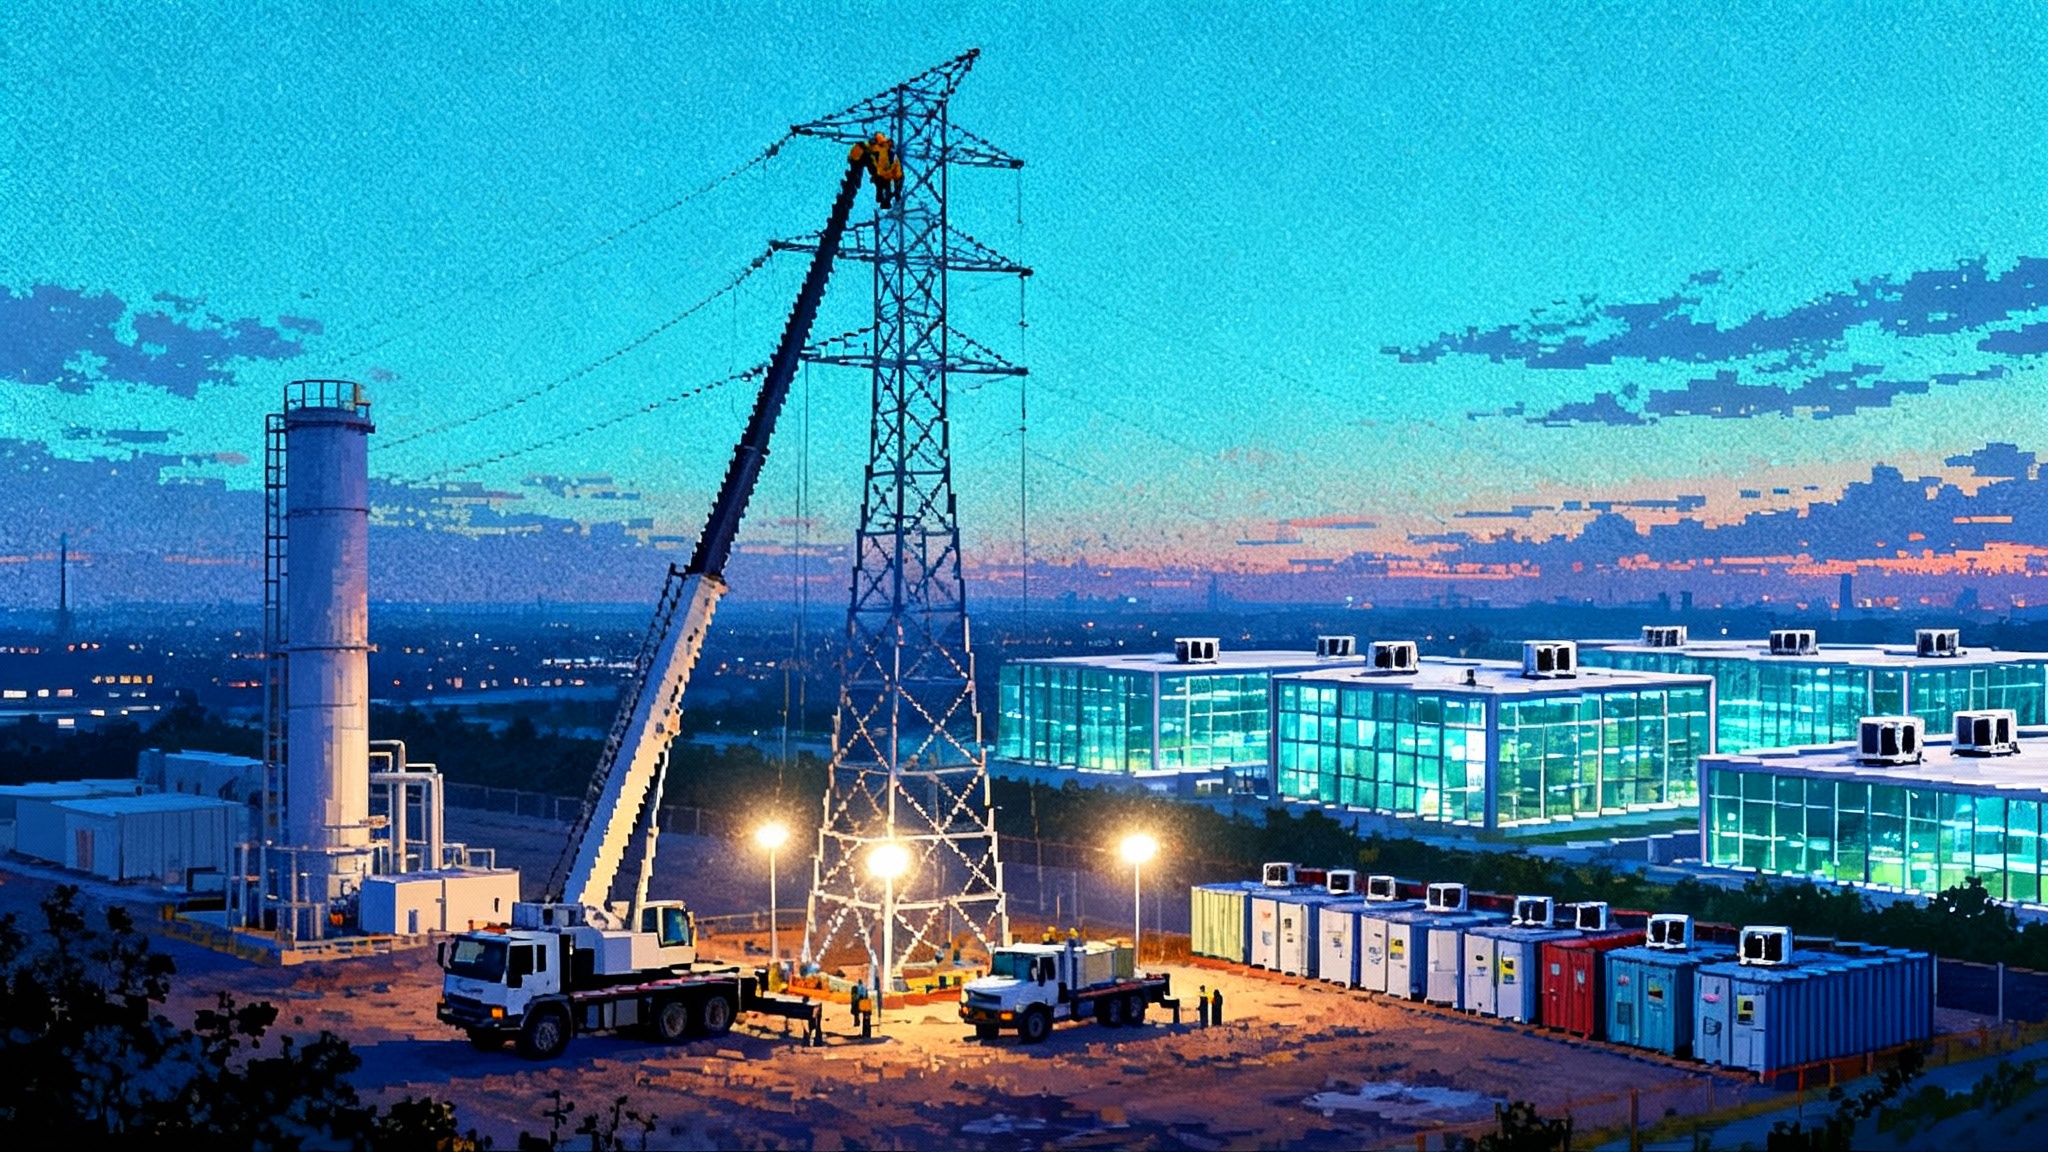
- RTOs and TOs with shovel‑ready 345–500 kV lines: Projects that are already through most state reviews or that replace existing lines can move fastest. They unlock immediate interconnection headroom and reduce curtailment.
- Storage developers with proven interconnection positions: Four to eight‑hour batteries at congested nodes clear queues faster than greenfield generation and provide reliability value that planners can count.
- Flexible gas: Aeroderivative peakers and quick‑start combined cycles with firm pipeline access will be procured to cover N‑1 and extreme weather events tied to data center clustering. Repowers at existing sites are especially advantaged.
- Nuclear uprates and life extensions: Uprates in the low single‑digit percentages across the existing fleet are low‑risk ways to add carbon‑free capacity by 2030. Where components are already ordered, these count as near‑term.
- Substation and transformer suppliers: Speed to Power will push federal coordination on long‑lead equipment. Players with domestic manufacturing advantage gain volume first.
Losers
- Stranded renewables in clogged interconnection queues: Projects without deliverability, network upgrades, or a path to a load pocket will sit. Queue reform helps, but physics and wires win.
- Coal units slated for near‑term retirement without retrofit plans: Some will be asked to extend, but many face rising maintenance costs, fuel logistics challenges, and environmental compliance risk. Without clear capacity payments, extensions are hard to finance.
- Single‑node merchant projects counting on congestion rents: As major upgrades right‑size or new lines energize, their arbitrage erodes.
- Long‑lead greenfield HVDC with unresolved state routes: Valuable in the long run, but unlikely to hit the 2028–2030 window that Speed to Power is targeting for AI load.
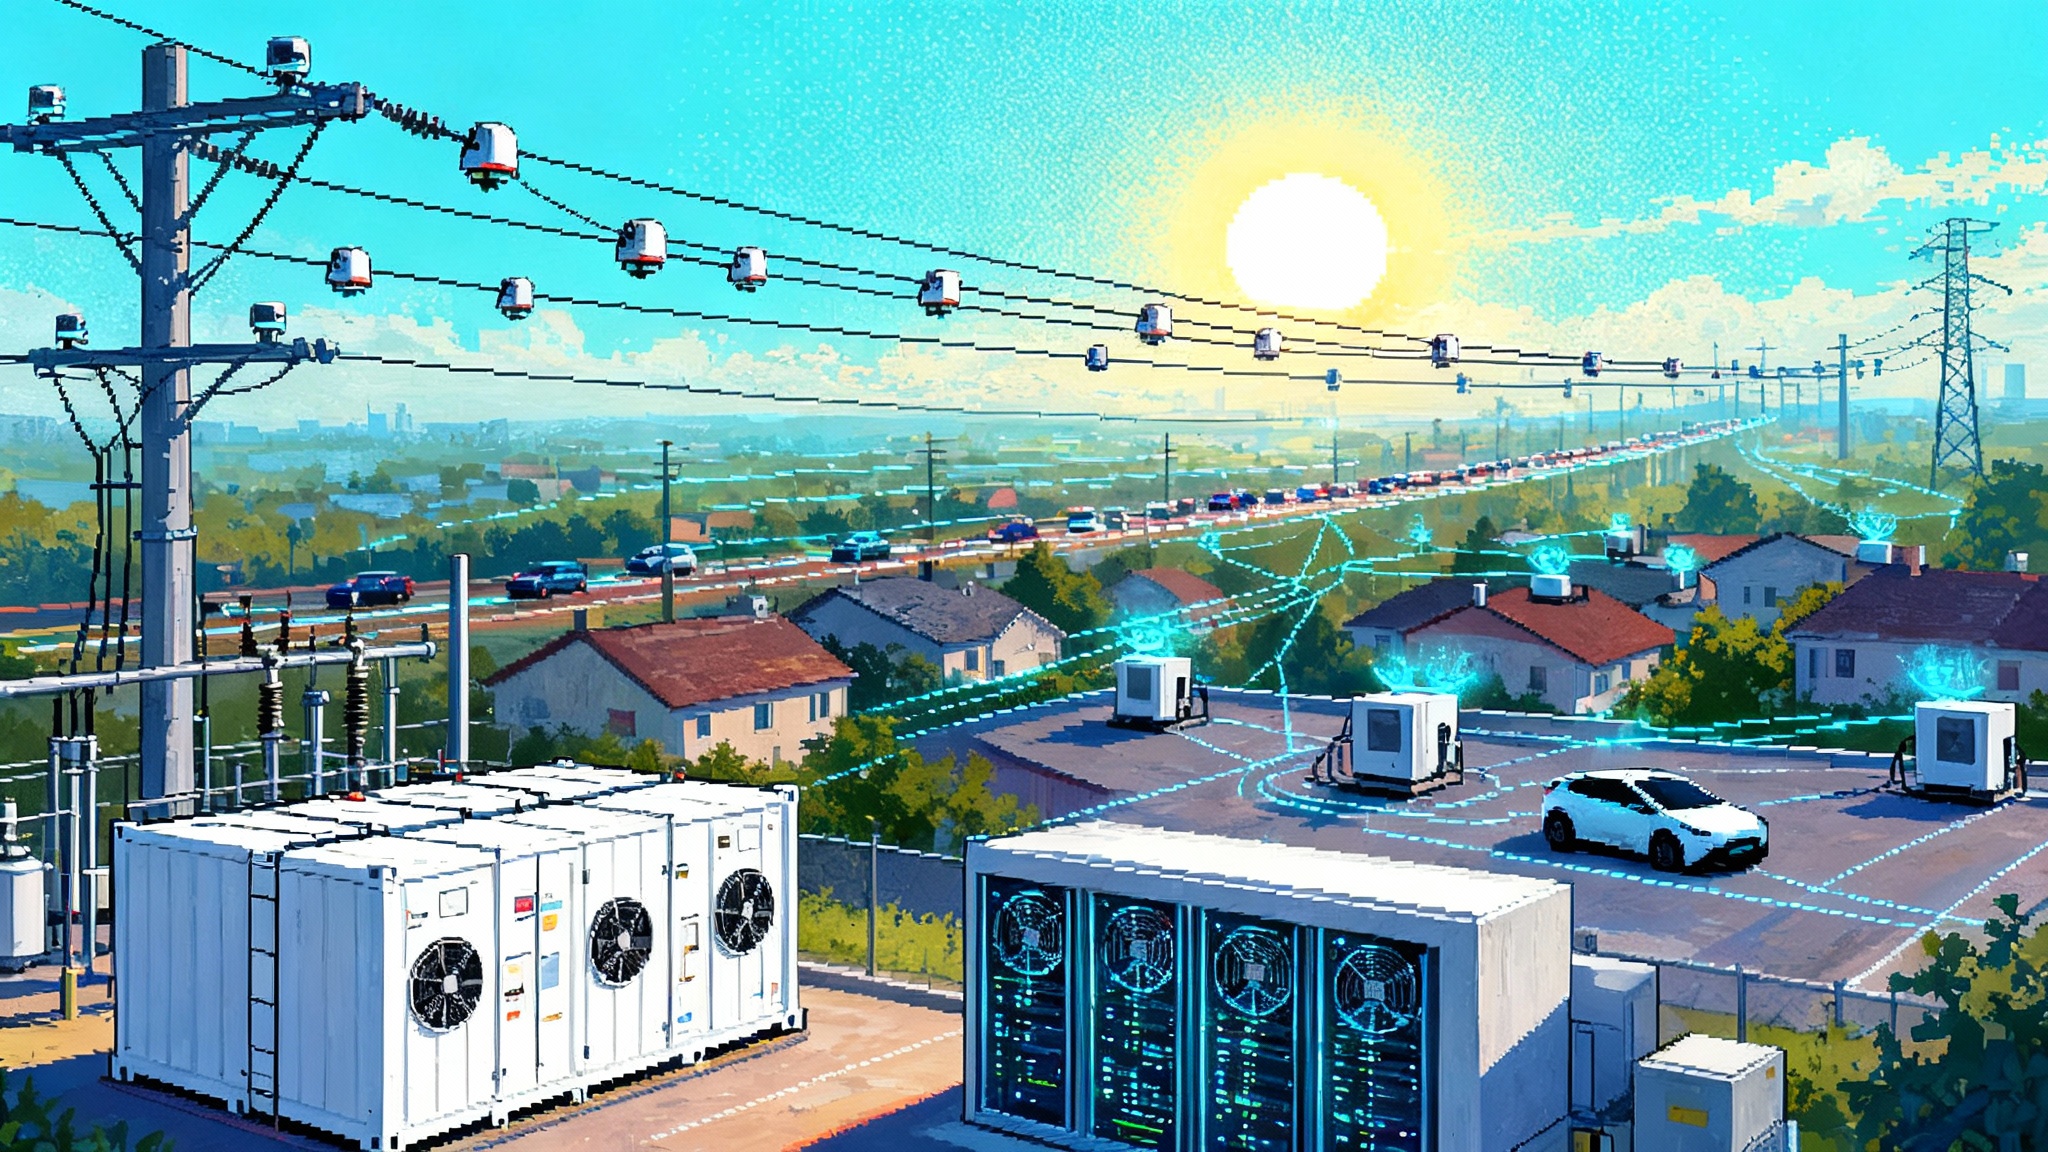
How much load is really coming from hyperscale data centers?
Let’s quantify the near‑term, 2025–2030, with a conservative central case based on announced campuses, county approvals, and typical build rates.
Assumptions
- Average hyperscale campus energizes 150–300 MW per phase, often in two phases inside 24–36 months.
- Power usage effectiveness continues to improve, but AI training and inference loads raise rack density. Net PUE improvement is modest.
- New campuses are clustered near multiple 230–500 kV substations with at least two feeds; that limits where very large campuses can land.
Central case results
- National: incremental 45–60 GW of peak demand tied to hyperscale data centers by 2030, with annual energy use rising by roughly 300–400 TWh. That puts data centers in the 6–8 percent range of total U.S. electricity consumption by 2030.
- Timing: Roughly 60 percent of the new capacity arrives in 2027–2030 as substation builds and large feeders catch up.
Regional breakdown
- Mid‑Atlantic and Northern Virginia (PJM, especially Dominion zone): 20–30 GW incremental peak by 2030, concentrated in Loudoun, Prince William, and neighboring counties with spillover into Maryland. Expect heavy substation expansions and 500 kV reinforcements to move bulk power from west and south into NoVA.
- ERCOT: 8–12 GW incremental peak, split between the Dallas‑Fort Worth triangle, Austin‑San Antonio corridor, and the Houston ring, with some West Texas siting near renewables paired to storage. Industrial load growth competes for the same capacity.
- Southeast (Duke, TVA, Georgia Power, FPL): 10–15 GW incremental, led by Atlanta’s I‑85 corridor, the Carolinas’ Research Triangle and Charlotte belts, and Nashville‑Memphis. Utilities will favor brownfield gas and 230–500 kV upgrades.
- Upper Midwest (MISO North and PJM ComEd): 4–6 GW incremental, with Chicago’s existing fiber hub drawing expansions and Minnesota‑Wisconsin seeing greenfield campuses where 345 kV access exists.
These ranges give utilities and policymakers a sanity check against their IRP assumptions. If your territory is not preparing for at least the low end of these bands, Speed to Power is going to feel like triage rather than acceleration.
Emissions and reliability: two scenarios for 2030
We model two simple national scenarios for the incremental 300–400 TWh of data center energy by 2030. Both assume aggressive transmission right‑sizing on replacements, modest nuclear uprates, and realistic storage build rates.
- Gas‑heavy catch‑up: 60 percent of the incremental energy served by gas combined cycles and peakers, 35 percent by new wind and solar, 5 percent by nuclear uprates and hydro. At 0.37 tCO2 per MWh for the marginal gas fleet, this yields roughly 67–89 million metric tons of additional CO2 in 2030. Reliability is strong if firm fuel is in place, but price volatility tracks gas markets and winterization.
- Balanced build: 35 percent gas, 55 percent wind, solar, and storage, 10 percent nuclear uprates and hydro. Emissions fall to roughly 39–52 million metric tons for the same load, and reliability hinges on siting storage in the right nodes and delivering more transmission that reduces curtailment.
Hotspot outlooks
- ERCOT: Reliability risk concentrates in winter events and localized congestion around load pockets. The fastest risk reducer is 345 kV expansion from West and South zones toward the metro hubs, paired with 4–8 hour storage at receiving substations. Flexible gas near DFW and Austin covers net load ramps driven by diurnal AI inference peaks.
- Mid‑Atlantic and Northern Virginia: The binding constraints are substation capacity and 500 kV deliverability into NoVA. Expect heavy use of reconductoring and right‑sizing on replacements. Gas siting faces pipeline and community constraints, so batteries and targeted dynamic line ratings will carry more weight. If transmission lags, local reliability margins thin and curtailment elsewhere in PJM rises.
- Southeast: Vertically integrated utilities can move fastest on brownfield gas and batteries, which stabilizes reserves but raises emissions in the gas‑heavy scenario. Transmission to connect multi‑state load clusters will define whether large solar fleets can run at higher capacity factors with storage.
- Upper Midwest: MISO North can add significant wind and hybrid projects if 345 kV projects in existing corridors proceed. The risk is winter peak adequacy during calm cold snaps. Gas with firm fuel in urban hubs and more seasonal DR from industry ease the edge cases.
How Speed to Power changes the playbook
- Portfolio first, project second: Order 1920’s long‑term planning favors portfolios that solve multiple problems at once. Speed to Power will move fastest on projects already proven in those portfolios with quantified multi‑benefits.
- Brownfield beats greenfield: Repowers, reconductoring, and right‑sized replacements are the shortest path to new capacity. DOE’s initiative implicitly elevates these because they compress permitting risk.
- Interconnection headroom becomes currency: Storage and flexible gas paired to substation upgrades often beat standalone generation for time to value. Expect more joint filings where a storage block is tied to a substation expansion funded through transmission tariffs.
- State‑federal choreography matters: With states holding the siting pen, the decisive advantage goes to projects with early governor‑PUC alignment. Expect more multi‑state MOUs to pre‑clear routes and cost shares before formal filings.
What to watch next
- The first project list: Which lines and plants DOE flags as near‑term accelerants under Speed to Power will reveal how much emphasis goes to brownfield upgrades versus new corridors.
- FERC 1920 compliance milestones: As regions file and refine compliance, watch for how they treat state roles in cost allocation and how quickly they initiate first long‑term planning cycles under the new rule set. The regions that front‑load scenario work in 2025 will have bankable portfolios by 2026.
- Substation supply chains: Lead times on large transformers and breakers are still long. Speed to Power may help broker capacity, but utilities that booked equipment early will own the critical path.
- Gas delivery and winterization: Flexible gas is a winner only if pipelines, storage, and plant winterization are in place. Expect a wave of fuel security dockets and firm‑fuel contracting.
The bottom line
Washington just put speed on the table. DOE’s Speed to Power gives the grid a triage mechanism and a new sense of urgency. FERC’s 1920 series makes sure the sprint is linked to coherent long‑term plans with real cost allocation and a formal role for states. Utilities and developers that come with shovel‑ready, brownfield‑heavy portfolios will move first. Those counting on greenfield miracles will wait.
If you are an RTO with a ready 500 kV right‑sizing package, a storage developer sitting on deliverability, or a utility that can uprate a nuclear unit by 2029, the window is opening. If you are a wind or solar project without a transmission plan or path to a data center load pocket, the queue will feel longer before it feels shorter.
The map to 2030 is not complicated. It is just tight on time. The players who plan for both speed and system value will take it from here.