The Solar Radar Era Begins: IMAP and SWFO‑L1 Launch
On September 24, 2025, IMAP and NOAA’s SWFO-L1 rode a Falcon 9 to L1, completing a Sun-to-Earth data chain with Parker Solar Probe. Space weather is shifting from art to infrastructure, enabling minute-to-day decisions for crews, launch ranges, and satellites.
Breaking orbit: a new sensor chain lights up
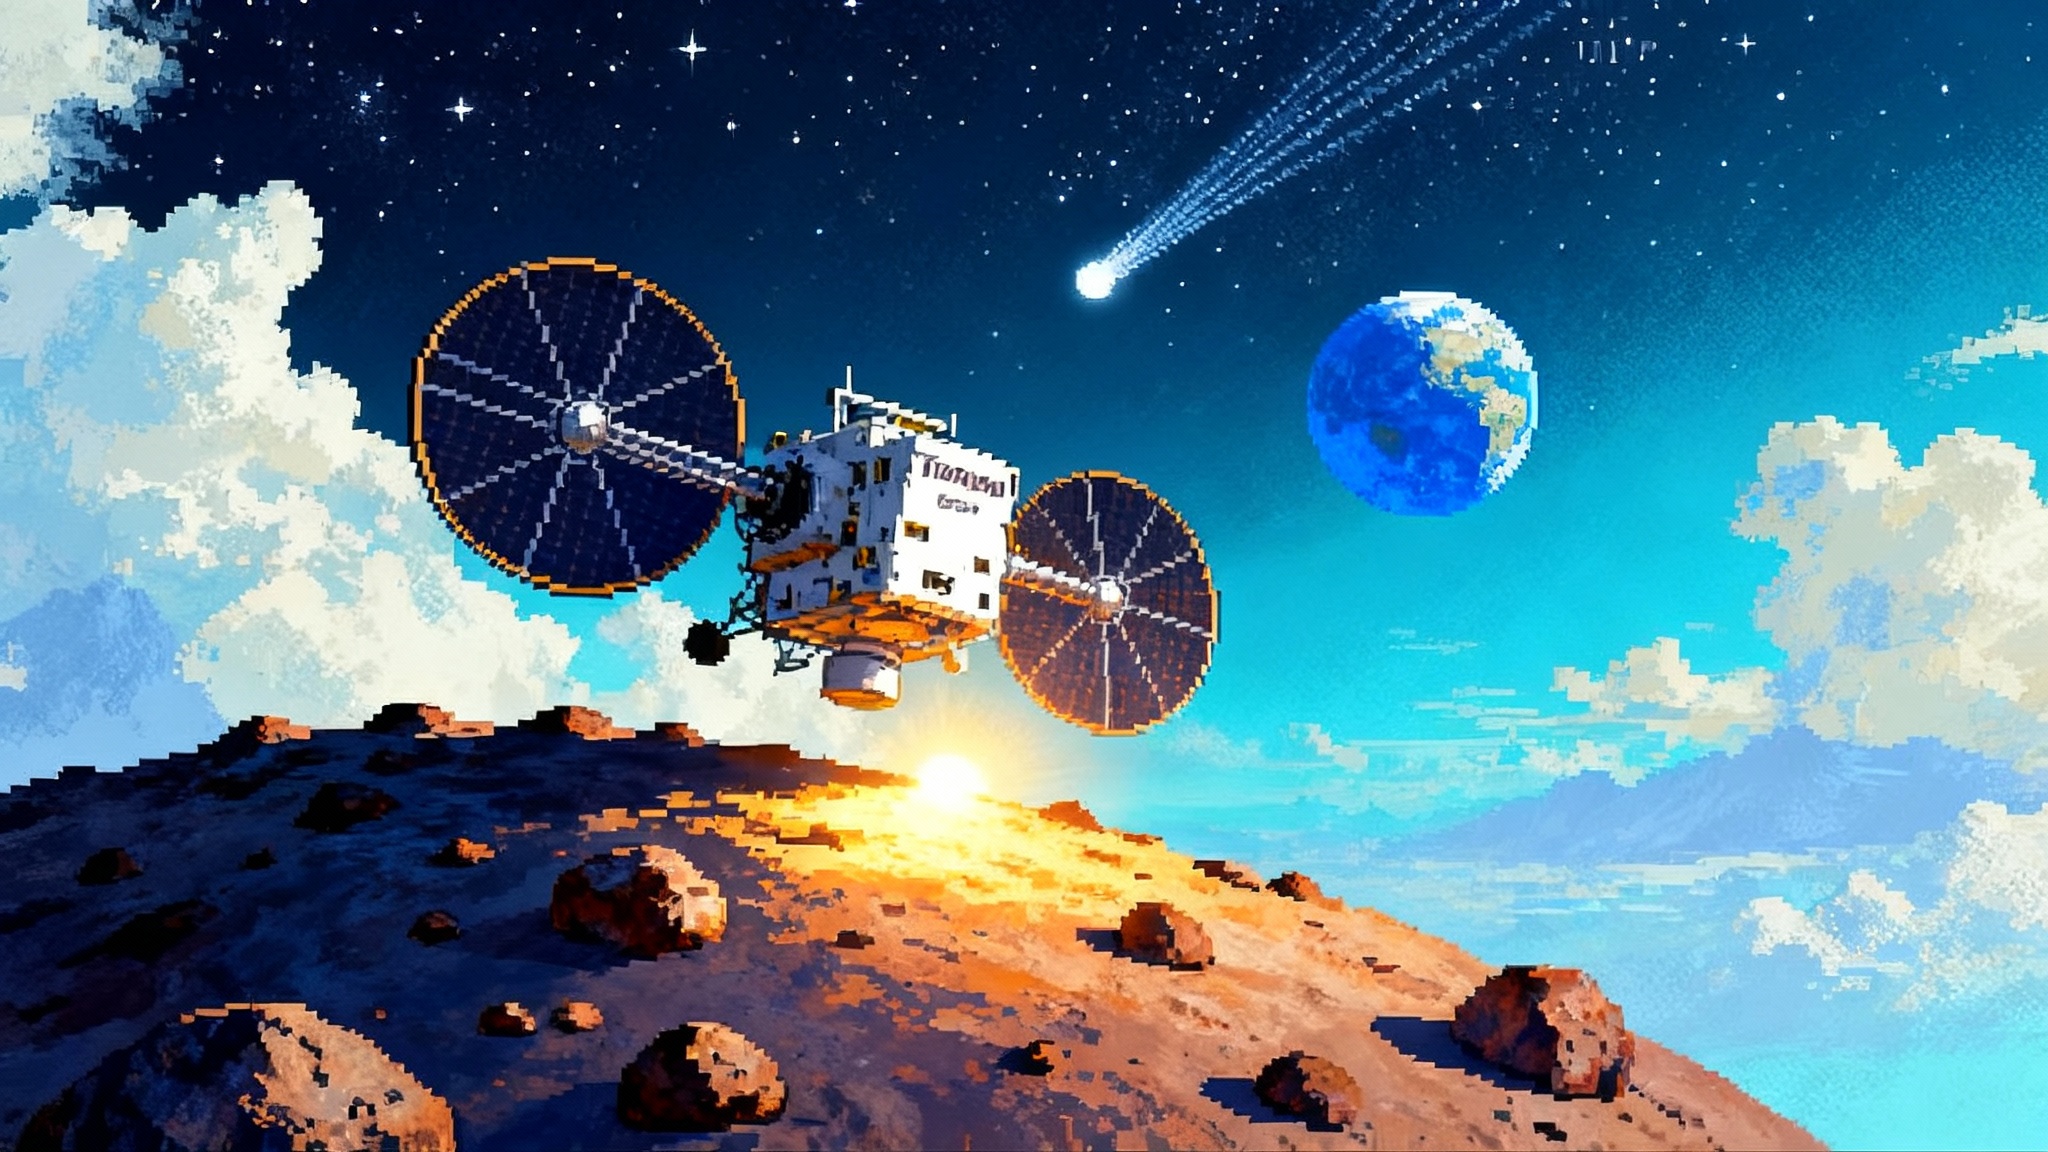
On the morning of September 24, 2025, a SpaceX Falcon 9 lifted three missions that will shape how we live and work beyond Earth: NASA’s Interstellar Mapping and Acceleration Probe (IMAP), the Carruthers Geocorona Observatory, and NOAA’s Space Weather Follow-On at L1 (SWFO-L1). Together they form the backbone of a continuous Sun-to-Earth data pipeline. Think of it as the first practical solar radar. With this launch, space weather begins to look less like an art practiced by a few forecasters and more like an operational infrastructure that can be scheduled, priced, and automated. See the official announcement in NASA and NOAA launched three missions.
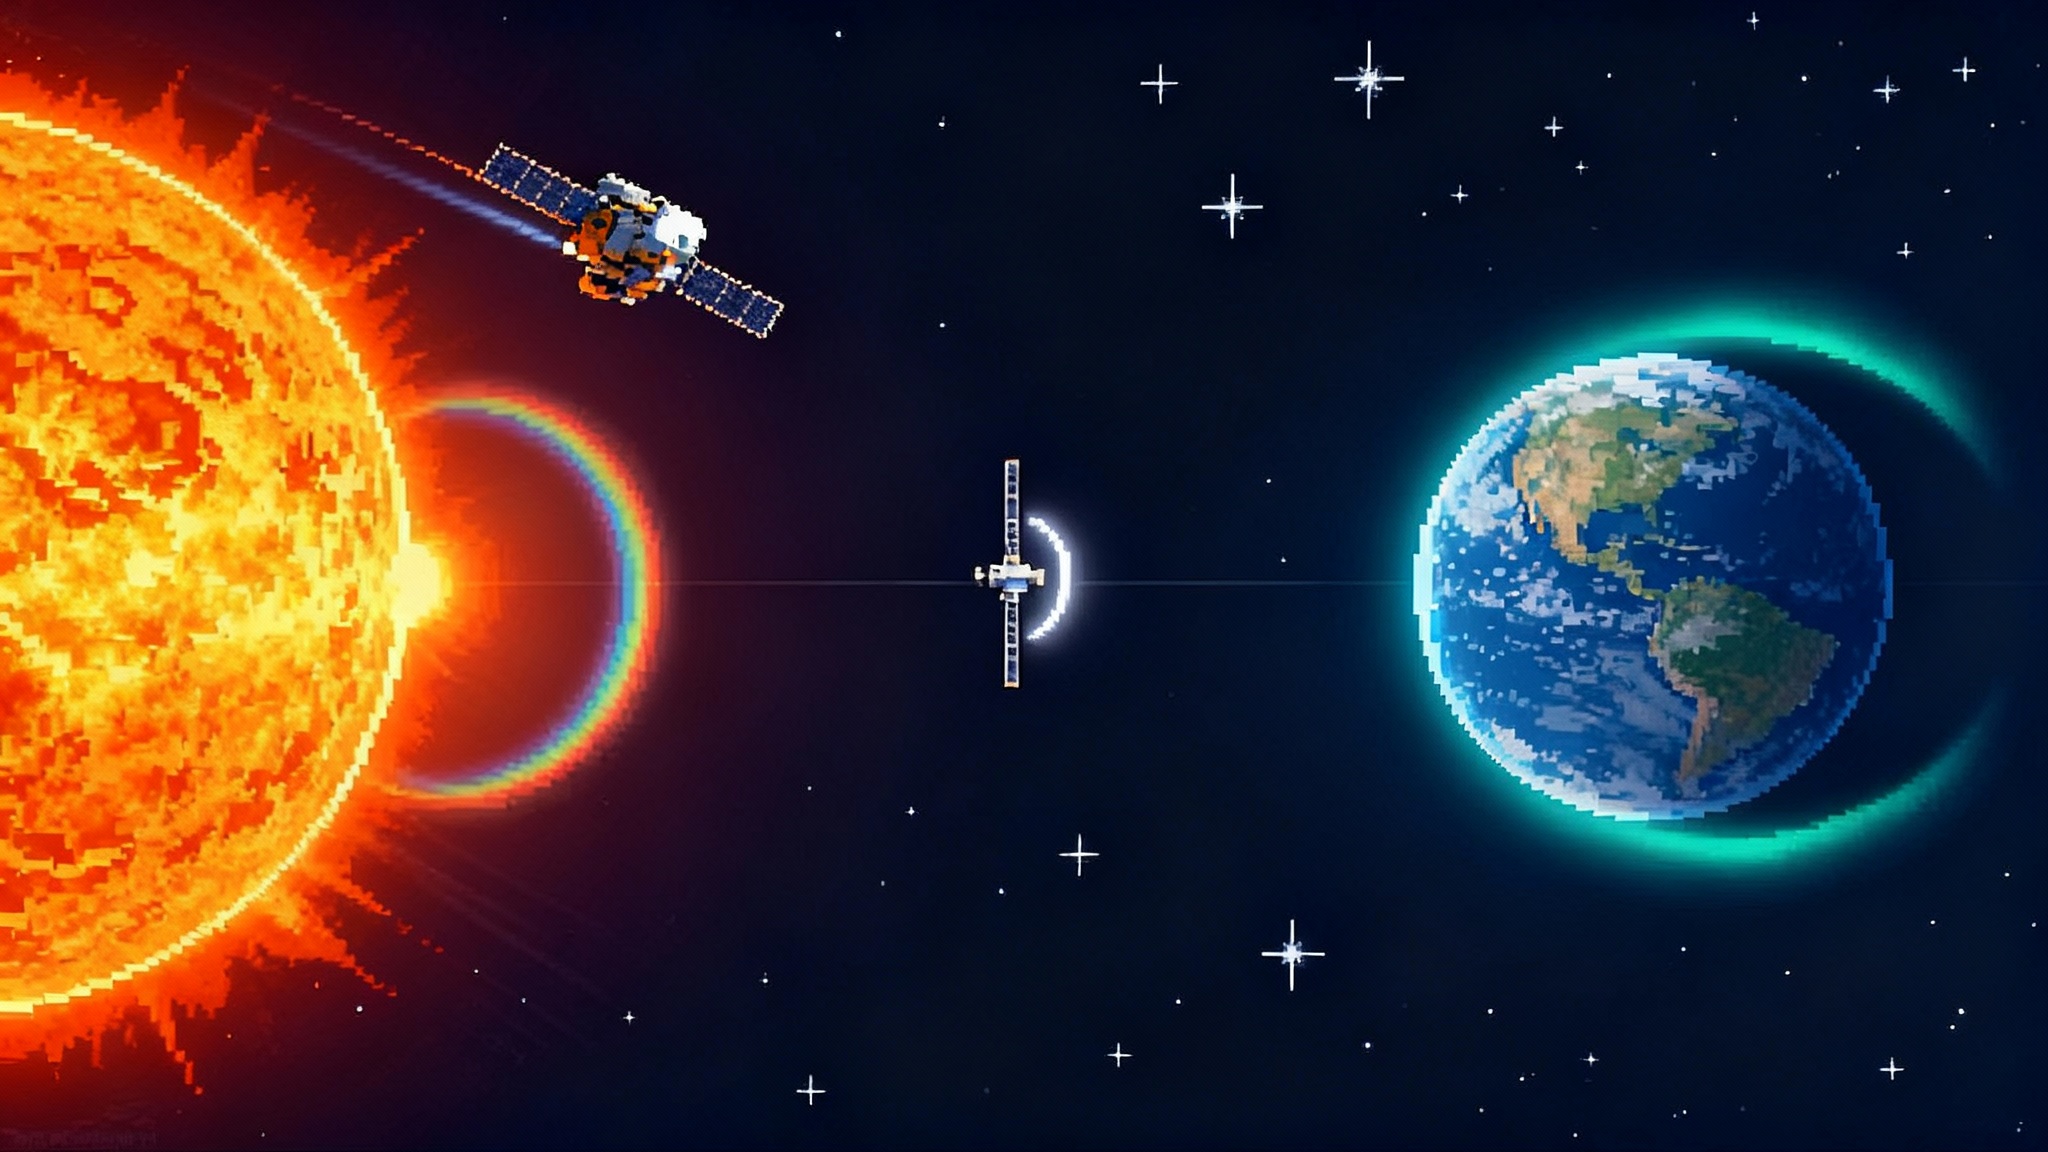
Parker Solar Probe spent 2025 skimming the inner corona at record speeds, sampling solar wind where it is born. Meanwhile, IMAP and SWFO-L1 are headed for the Sun–Earth L1 point about one million miles sunward of Earth, where they will stare into the solar wind and coronagraph the outer atmosphere of the Sun. As this chain comes online, agencies and companies gain minutes to hours of particle warnings and hours to days of geomagnetic storm guidance. That is the difference between an astronaut finishing an extra‑vehicular task and an astronaut sprinting to a storm shelter.
From art to infrastructure
Meteorology grew up when radar arrived. Space weather has lacked its radar. Observatories saw eruptions. A handful of upstream spacecraft sampled the wind. Models filled the gaps. But the network never stitched together into a dependable, end‑to‑end feed that operators could plug into flight software and insurance ledgers. The result was a patchwork of advisories and rules of thumb.
The new pipeline closes the loop. Parker Solar Probe supplies near‑Sun physics. SWFO‑L1 supplies continuous coronagraph images and upstream in‑situ readings. IMAP adds high‑fidelity particle composition, energetic neutral atom maps, and solar wind context. On the ground, NOAA’s Space Weather Prediction Center and NASA modeling centers ingest those data to produce ensemble forecasts with arrival times, intensity envelopes, and confidence bands. Instead of a human reading tea leaves, you get machine‑readable hazard fields and countdown clocks.
How the solar radar actually works
A real radar bounces radio waves and measures echoes. Solar radar uses a time‑sequenced chain of sensing and physics.
- Near the Sun, Parker Solar Probe flies through the corona, detecting how turbulence and magnetic switchbacks seed solar energetic particle events. These measurements tune the physical parameters in particle acceleration models.
- In white light, coronagraphs like CCOR on SWFO‑L1 image the expanding halo of a coronal mass ejection as it leaves the Sun. The observed expansion rate, direction, and brightness yield the mass and radial speed of the ejection. CCOR‑1 riding on GOES‑19 and CCOR‑2 on SWFO‑L1 give redundancy and geometry, similar to having two weather radars viewing a storm from different angles.
- In situ at L1, SWFO‑L1’s instruments measure the incoming solar wind speed, density, temperature, magnetic field, and suprathermal particles. The magnetic field orientation is critical. Southward fields couple strongly to Earth’s magnetosphere and drive intense geomagnetic storms.
- IMAP samples the particle population and maps the heliosphere via energetic neutral atoms, tying local conditions to global structure. It also streams solar wind and radiation context as an always‑on background feed.
- Assimilation codes run the observations through propagation models like Wang‑Sheeley‑Arge and magnetohydrodynamic ensembles. Forecasters get arrival windows for shock fronts and dense sheaths. Operators get the forecast as an API.
This chain yields two distinct clocks. The first is the fast clock. High‑energy particles from a solar flare can arrive in tens of minutes. L1 data alone cannot catch those in time, so coronagraph‑plus‑Parker context is essential to recognize flare conditions likely to accelerate particles and to alert crews early. The second is the slow clock. Bulk plasma from a coronal mass ejection takes roughly 15 to 72 hours to reach Earth, depending on speed. Coronagraphs set the initial conditions. L1 in‑situ measurements refine the final hour. Together the clocks handle minutes‑to‑days.
What changes for astronauts in 2026 and 2027
Hour‑to‑day radiation routing becomes real. Here is how it works for lunar missions:
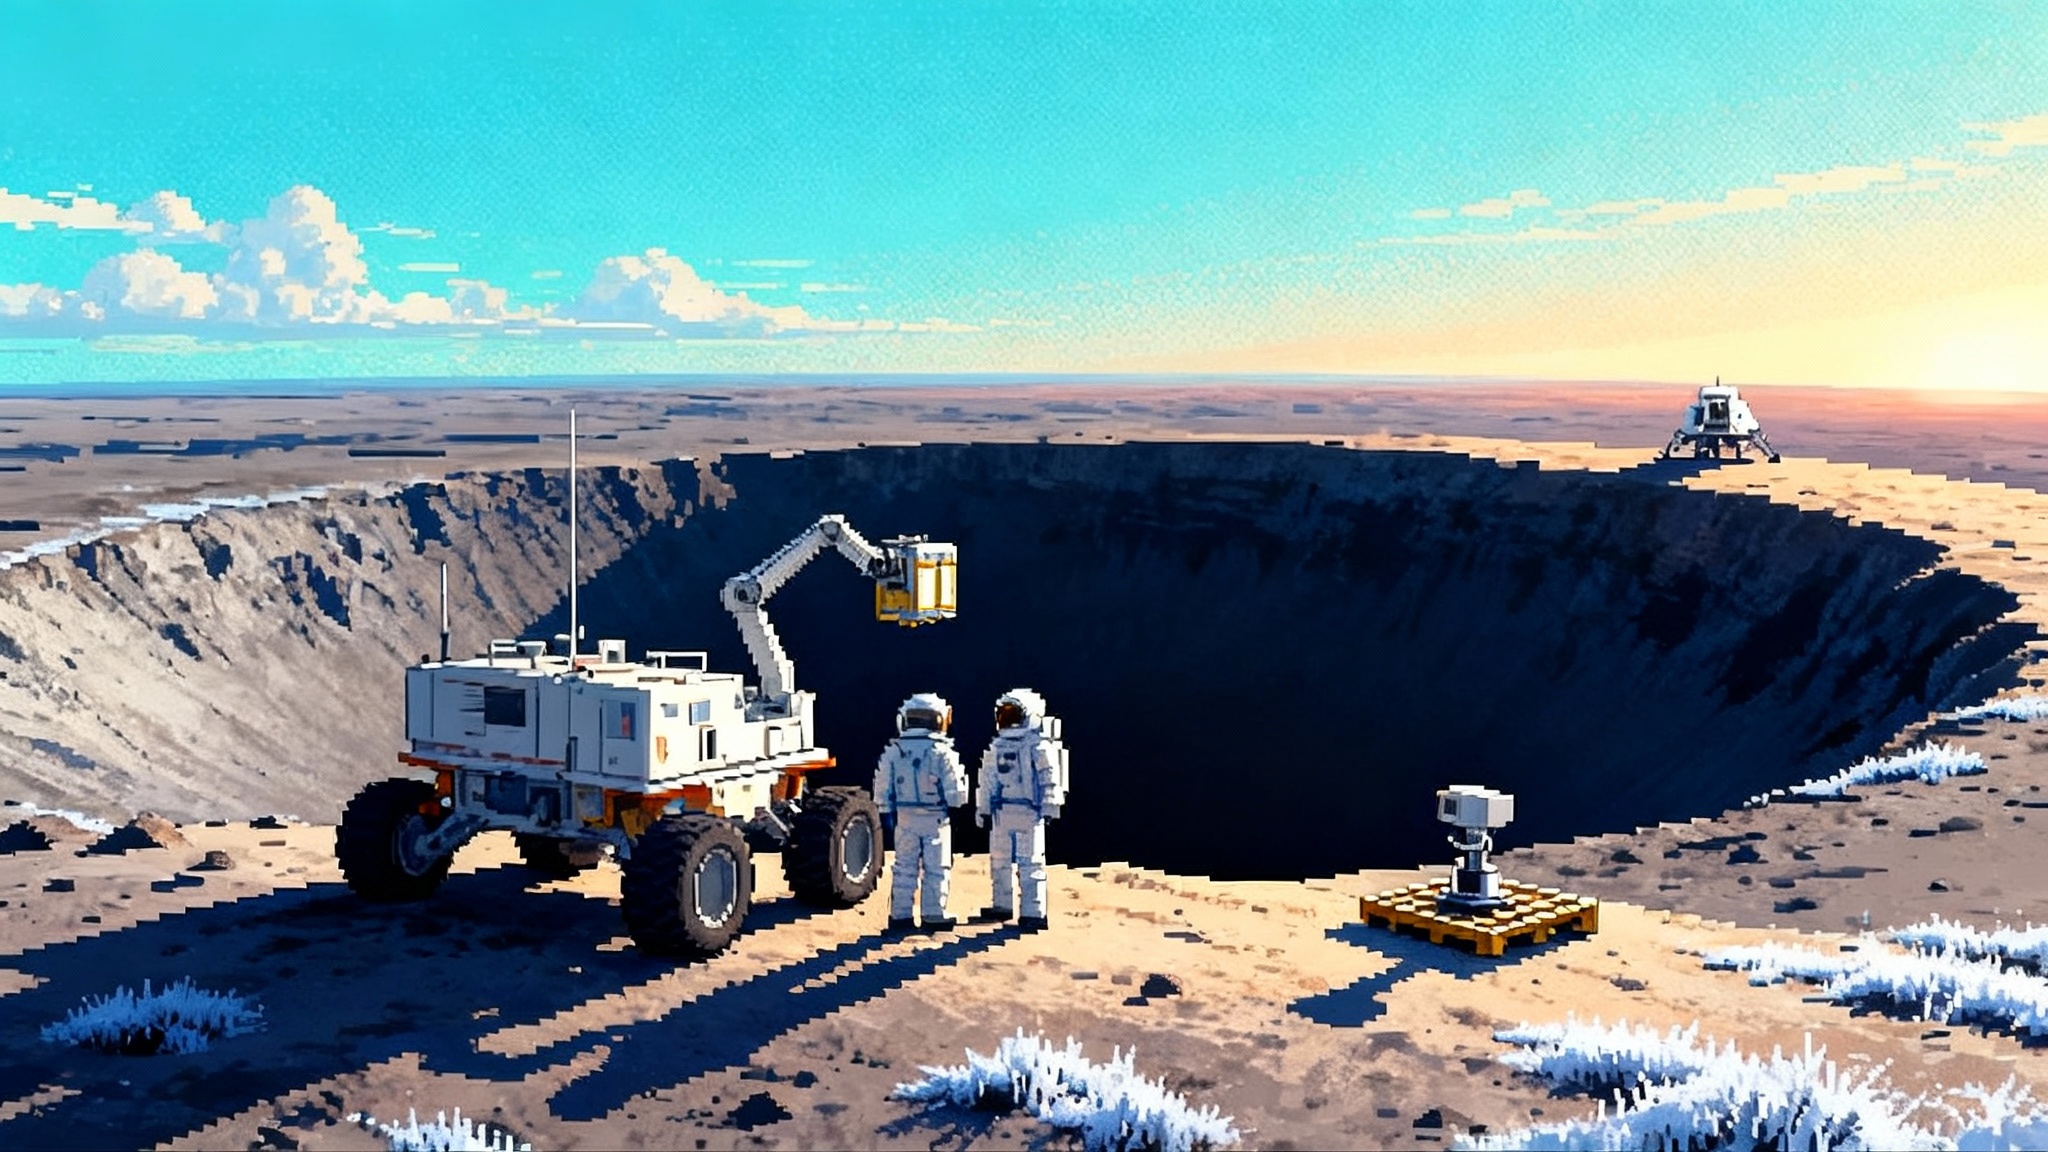
- Plan EVAs inside wide safety windows. When coronagraphs catch a halo ejection aimed even partially our way, the forecast generates a moving hazard envelope. EVA planners shift tasks to earlier slots or defer to the next lunar day rather than gambling on a borderline forecast. For mission design context at the poles, see our analysis of the rover that unlocks Artemis.
- Stage shelters by the clock. If a particle event looks likely, crews pre‑position water and polyethylene panels around their habitat’s safe room and ensure power is routed to those spaces. The goal is to minimize time‑to‑shelter to under 10 minutes.
- Route rovers with fallbacks. Long‑range surface traverses include rendezvous nodes with pre‑cached shielding. Routes are picked so that any point on the path is less than a specific sprint time from a shelter node.
- Use L1 magnetic field nowcasts to decide whether to keep Orion or the Human Landing System in a low‑risk loiter posture or commit to a descent window. A southward turn in the interplanetary magnetic field at L1 triggers a go‑no‑go reevaluation.
All of this is simple if the data are reliable and fast. SWFO‑L1’s instrument suite is designed for operational cadence. IMAP is designed for continuous context. NOAA’s operations center turns those measurements into alerts with defined thresholds. That is what makes this infrastructure, not just science.
A smarter launch range
Launch windows already bend to ground weather and range safety. Now they will flex to space weather with the same discipline.
- Upper stage navigation and spacecraft initialization are most vulnerable in the first orbits. Solar energetic particles spike single‑event upsets and latch‑ups in avionics. If coronagraph‑driven models flag a particle event window overlapping ascent or early operations, the cost of a short hold often beats the risk of on‑orbit anomalies. For how launch cadence is evolving, see the pivot from spectacle to operations.
- Geomagnetic storms puff up Earth’s upper atmosphere, raising drag and changing orbit insertion requirements. For low Earth orbit satellites similar to the 2022 group that suffered unexpected decay after a storm, a 24 to 48 hour slip can be the difference between healthy margin and premature reentry.
- Polar launches and high‑inclination trajectories traverse regions where radiation doses rise sharply during storms. Range rules can adopt dose rate limits linked directly to SWPC alerts, just as wind and anvil‑cloud rules are tied to terrestrial radar.
For operators, the change is cultural as much as technical. Instead of treating space weather as an afterthought, it becomes a first‑order constraint with a quantitative penalty function.
Real‑time risk pricing for satellites
Satellites, insurers, and investors are hungry for risk that can be priced minute by minute. The new data chain feeds that appetite.
- Dynamic premiums for on‑orbit maneuvers. Insurers can adjust premiums for high‑risk activities such as electric orbit raising during an elevated particle environment. If SWFO‑L1 flags rising suprathermal ion flux and a southward field, prices tick up until the storm passes.
- Contract triggers tied to indices. Operators and reinsurers can write micro‑covers keyed to forecast Kp or dB/dt thresholds in the next 24 hours. That is only viable if the forecasts are good and continuously updated.
- Asset management at constellation scale. Operators can preemptively reorient solar panels, change duty cycles, and gate sensitive payload electronics based on probabilistic arrival windows. A one percent efficiency hit for a day beats a one percent attrition rate over a year.
The punchline is not that storms go away. It is that exposure gets managed with the same tools used for wind shear and lightning in aviation.
Who built the radar
This is not one spacecraft. It is a factory line.
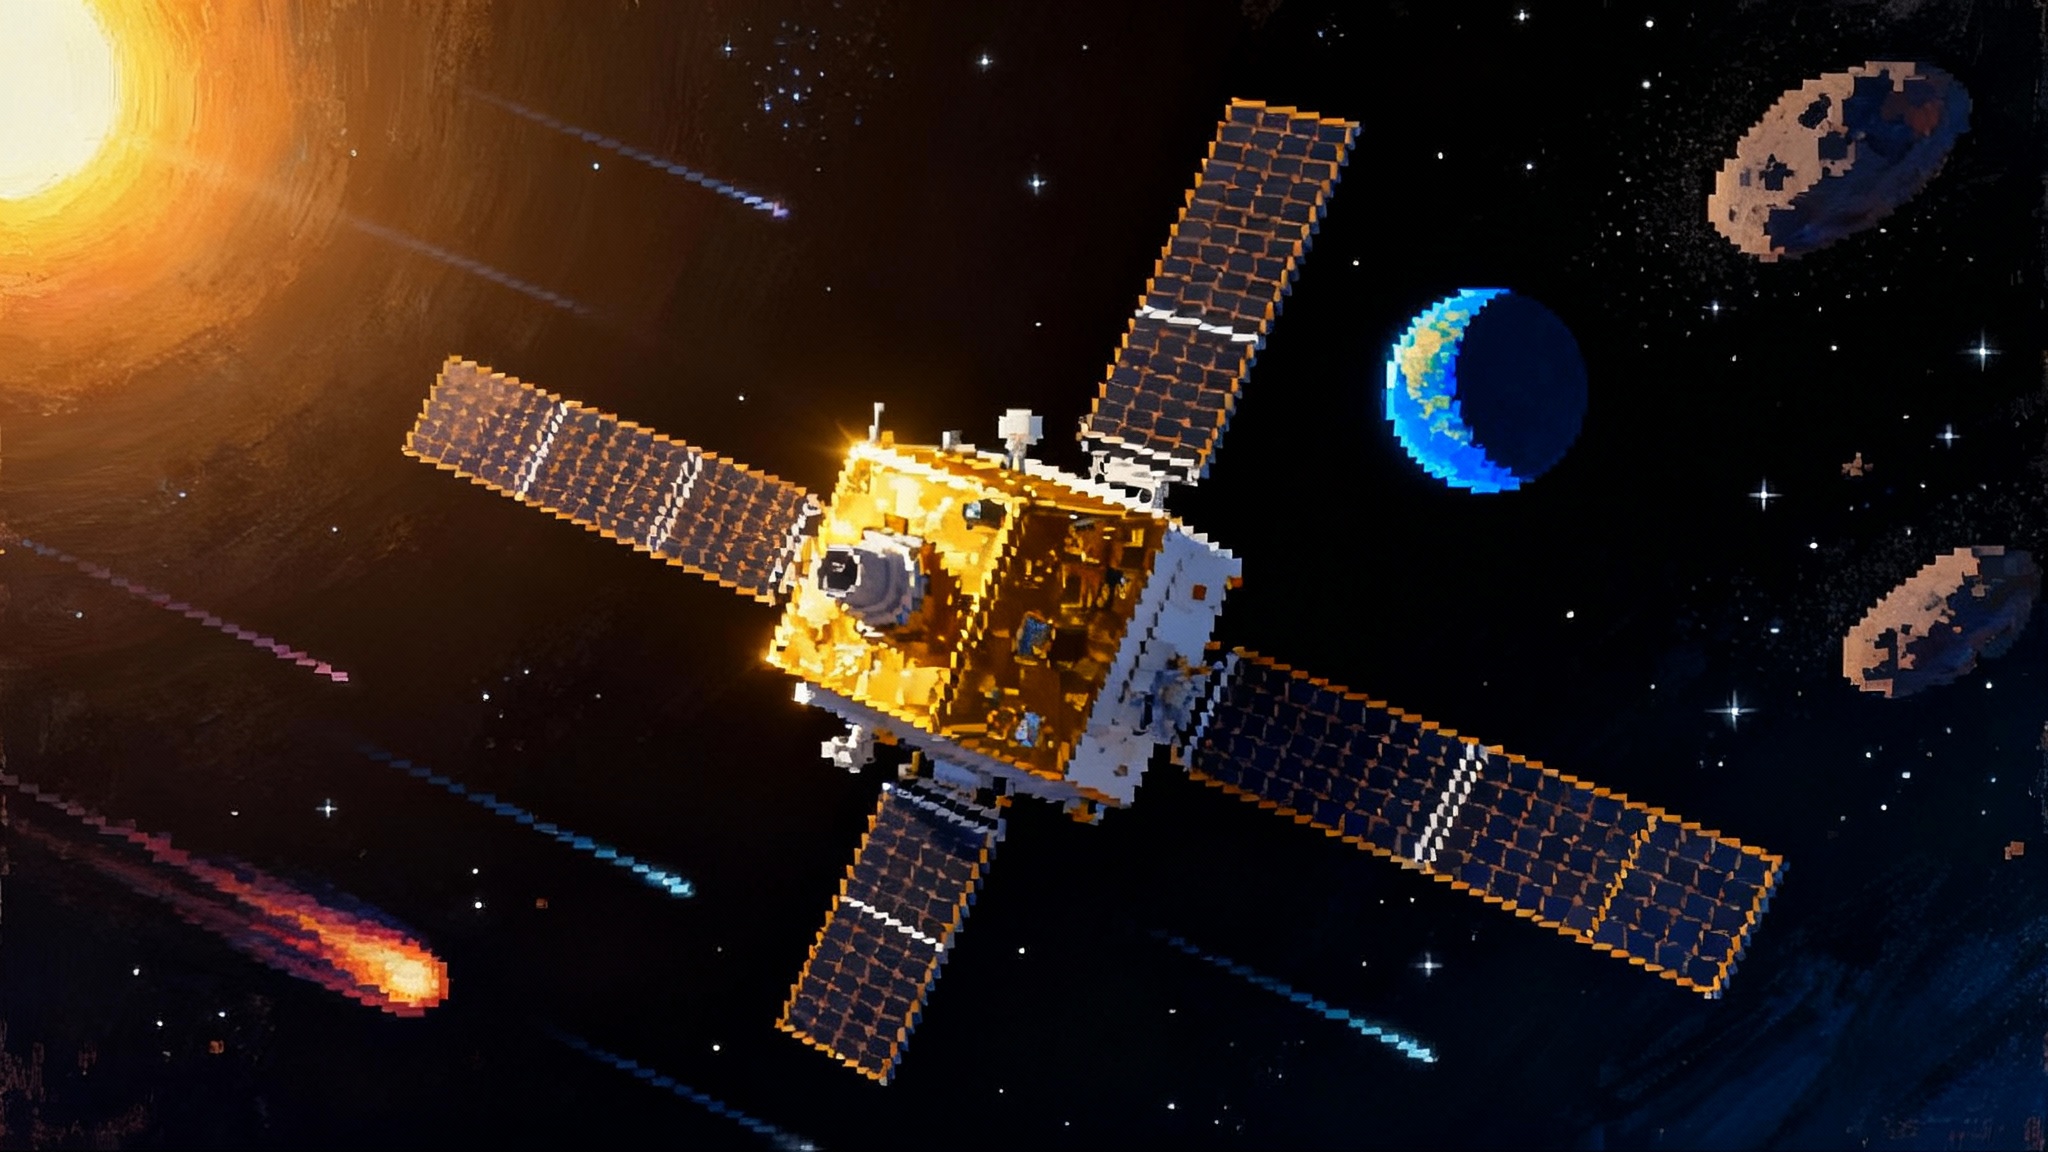
- SWFO‑L1 is an operational NOAA observatory built by BAE Systems with instruments from the U.S. Naval Research Laboratory, Southwest Research Institute, the University of California Berkeley, and the University of New Hampshire. Its Compact Coronagraph CCOR‑2 gives forecasters a continuous movie of the Sun’s outer atmosphere, and its plasma, suprathermal, and magnetometer sensors take the wind’s vital signs upstream of Earth. See NOAA’s update in SWFO‑L1 successfully launched.
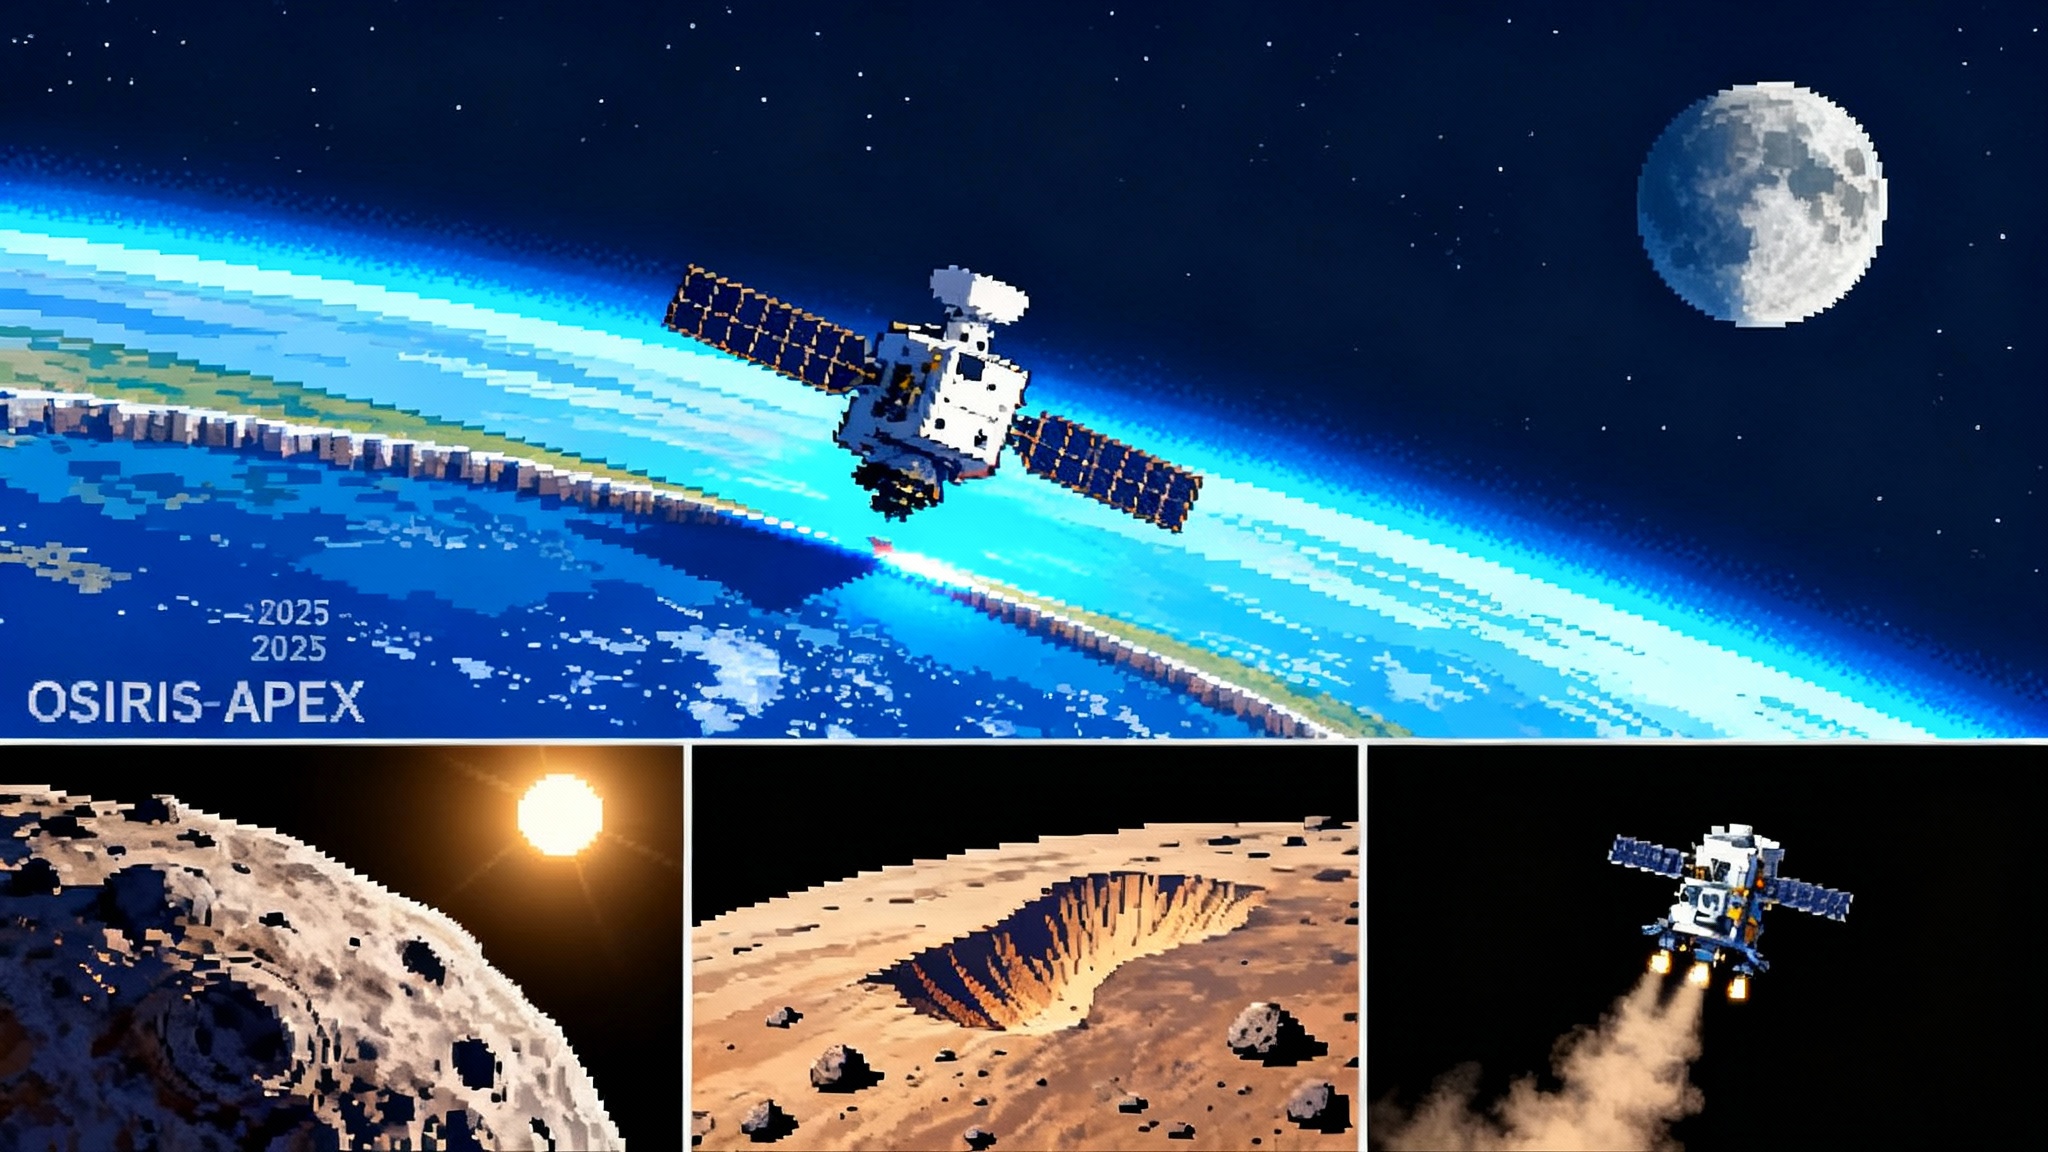
- IMAP is a NASA mission led by Princeton University and operated by Johns Hopkins Applied Physics Laboratory. It carries ten instruments to map the heliosphere and track how particles are accelerated from the Sun to interstellar space. IMAP’s location at L1 enables roughly 30 minutes of early radiation warning for assets near Earth while delivering science data that sharpen forecasts.
- Parker Solar Probe is a NASA and Johns Hopkins APL mission that repeatedly dips into the corona, measuring the plasma and fields where hazards begin. In 2025 it matched its closest approaches and record speeds, giving modelers high quality inner‑heliosphere measurements while the L1 observatories were coming online.
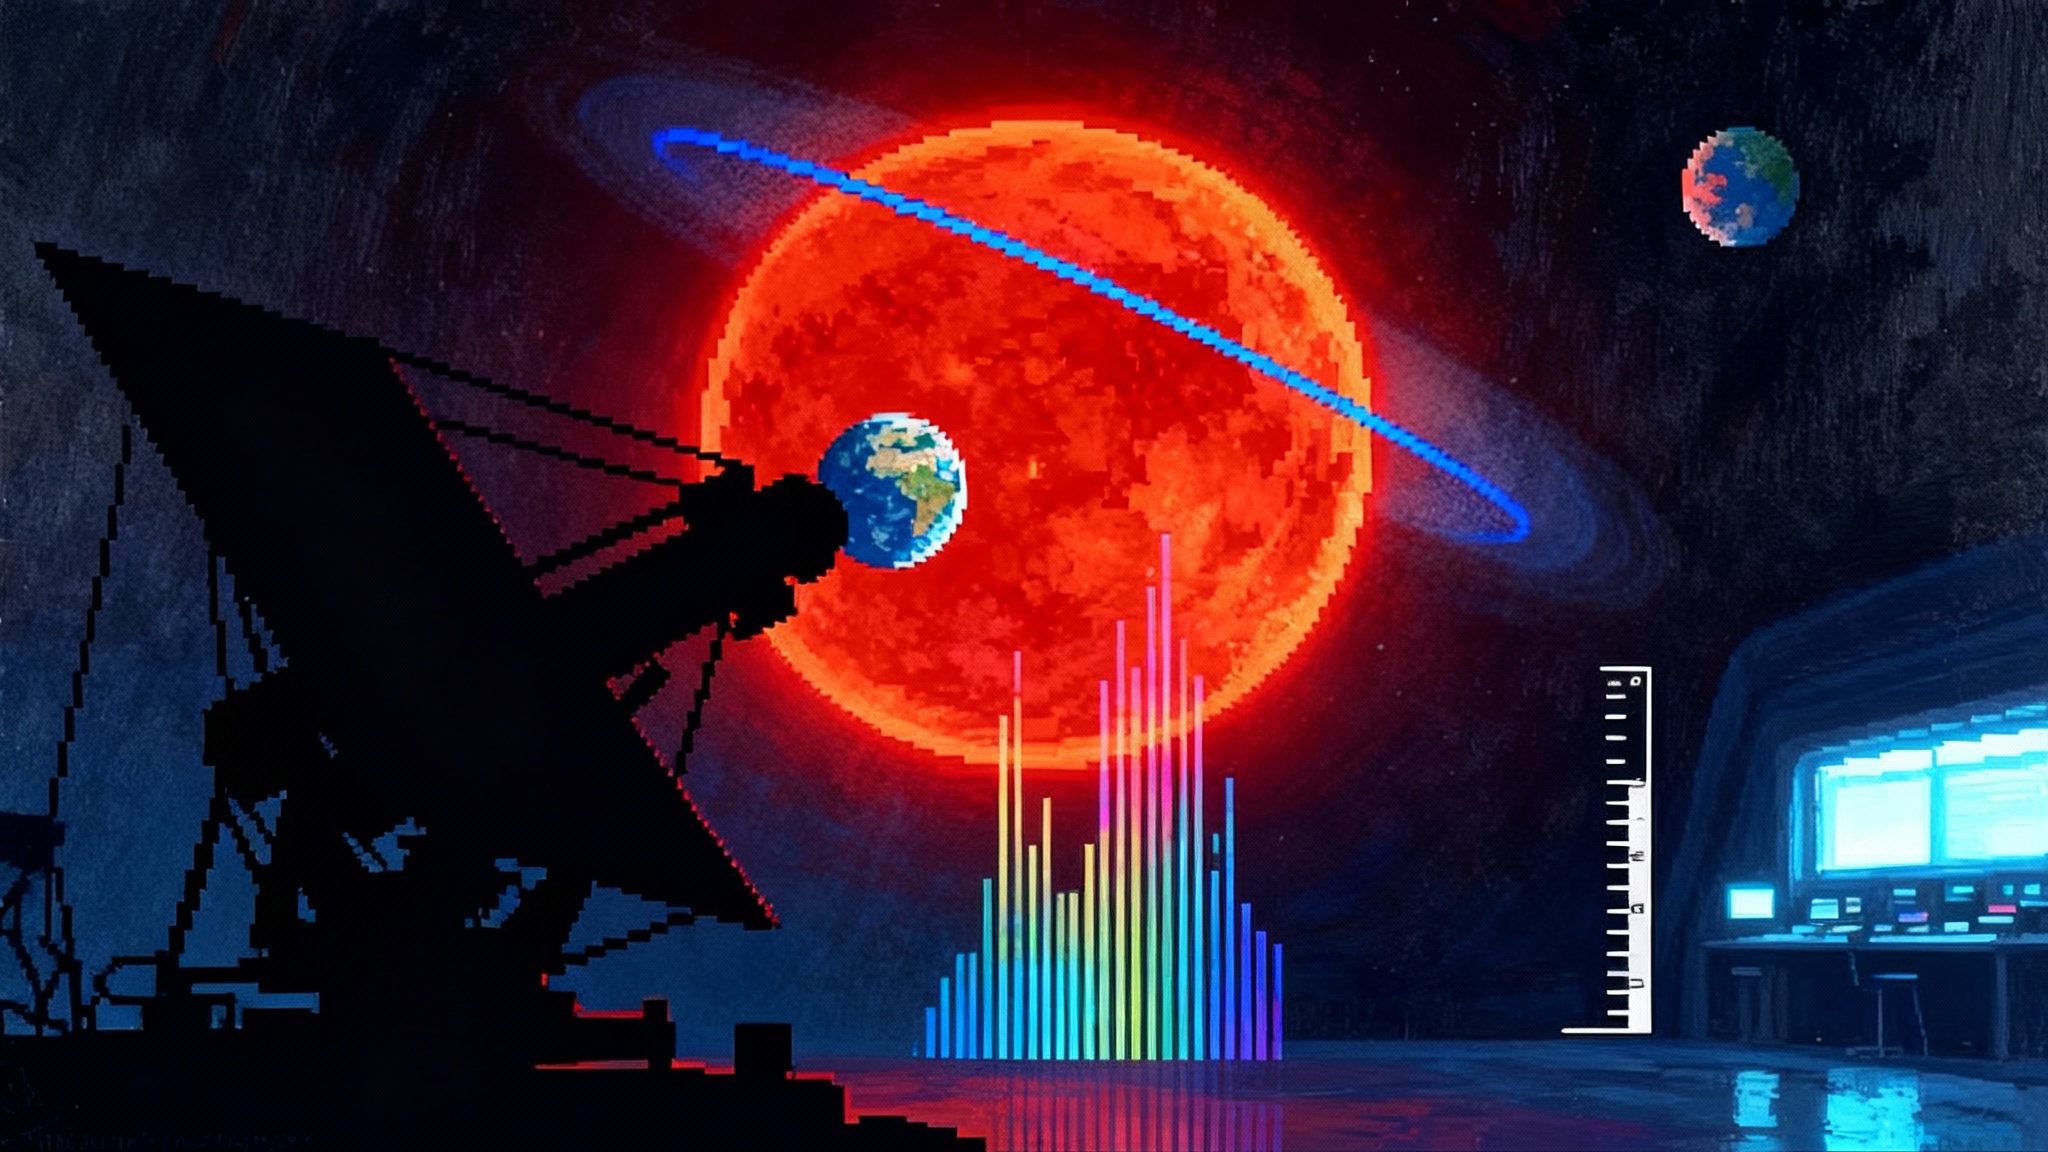
- On the ground, NOAA’s Space Weather Prediction Center in Boulder moves these data through operations, while NASA’s modeling hubs help tune and validate the physics. The pipeline is a public good operated in the open, where universities and companies can build services on top.
Timelines that matter
- Transit and commissioning. After the September launch, SWFO‑L1 cruises to L1, with commissioning scheduled to complete in mid‑2026. IMAP reaches L1 on a similar timeline and begins science operations soon after. The point is not a ribbon cutting. It is a stepwise ramp where each new data product enters real‑time forecasts as it clears verification.
- Artemis integration. As NASA readies crewed lunar operations in 2026 and 2027, mission rules will embed space weather thresholds alongside thermal and propellant margins. Expect EVA scheduling software to ingest forecast hazard fields, and training to emphasize time‑to‑shelter drills tied to alert latencies.
- Mars design implications. The next Mars mission designs will assume an operational solar radar. Surface habitat walls will be optimized not only for average dose but for shelter response time. Cruise phases will include quiet‑Sun windows and contingency maneuvers triggered by coronagraph‑derived shock predictions.
- Commercial uptake. Expect launch providers to publish space weather constraints in range documentation. Satellite manufacturers will market boards with radiation‑hard modes keyed to SWPC alerts. Insurers will pilot products that discount premiums for operators who demonstrate automated storm response.
What to watch for next
- The first coordinated forecast wins. Look for the first declared storm forecast where CCOR imagery, Parker data, and L1 in‑situ measurements all play a documented role in a correct arrival and intensity call. When that happens, the case study will become a template for flight rules.
- Latency and uptime. The true test of an operational observatory is not only accuracy but speed and reliability. Watch the data latency and coverage numbers from SWFO‑L1 and IMAP. If they meet their targets, model assimilation windows can shrink and confidence bands can tighten. For a preview of operational alert culture, see how the real‑time sky begins.
- Forecast standardization. Expect open schemas for space weather alerts that align with aviation and power grid needs. Think common fields, units, and severity levels so that a rover, a launch range, and a trading desk can all read the same message.
- Redundancy planning. With GOES‑19 carrying CCOR‑1 in geostationary orbit and SWFO‑L1 carrying CCOR‑2 at L1, forecasters have resilience. Agencies will test failover. Commercial operators should do the same.
The takeaway
The real promise is not a single breathtaking image or a record speed. It is a dependable feed that turns the Sun’s moods into numbers operators can act on. That is what brought aviation from weather lore to robust scheduling. It is what will bring human spaceflight from heroic exception handling to routine planning.
With IMAP and SWFO‑L1 aloft and Parker Solar Probe still threading the inner corona, the pieces are finally arranged from the Sun to Earth. The infrastructure will not eliminate risk, but it will make risk visible on a clock and a map. For astronauts planning an EVA, for a launch director eyeing a tricky ascent, and for a satellite insurer juggling exposure, that is the difference that matters. The solar radar era has begun, and it will reshape the way we design, schedule, and insure exploration in the years ahead.