SPHEREx Goes Live: The 102-Color All-Sky Engine of Discovery
Fresh off first-light images, NASA’s SPHEREx has begun a 102-color, all-sky infrared survey that repeats every six months. Here is what that milestone unlocks next and how open data can speed discoveries for researchers and advanced amateurs alike.
First images, first proof: the sky just added 102 colors
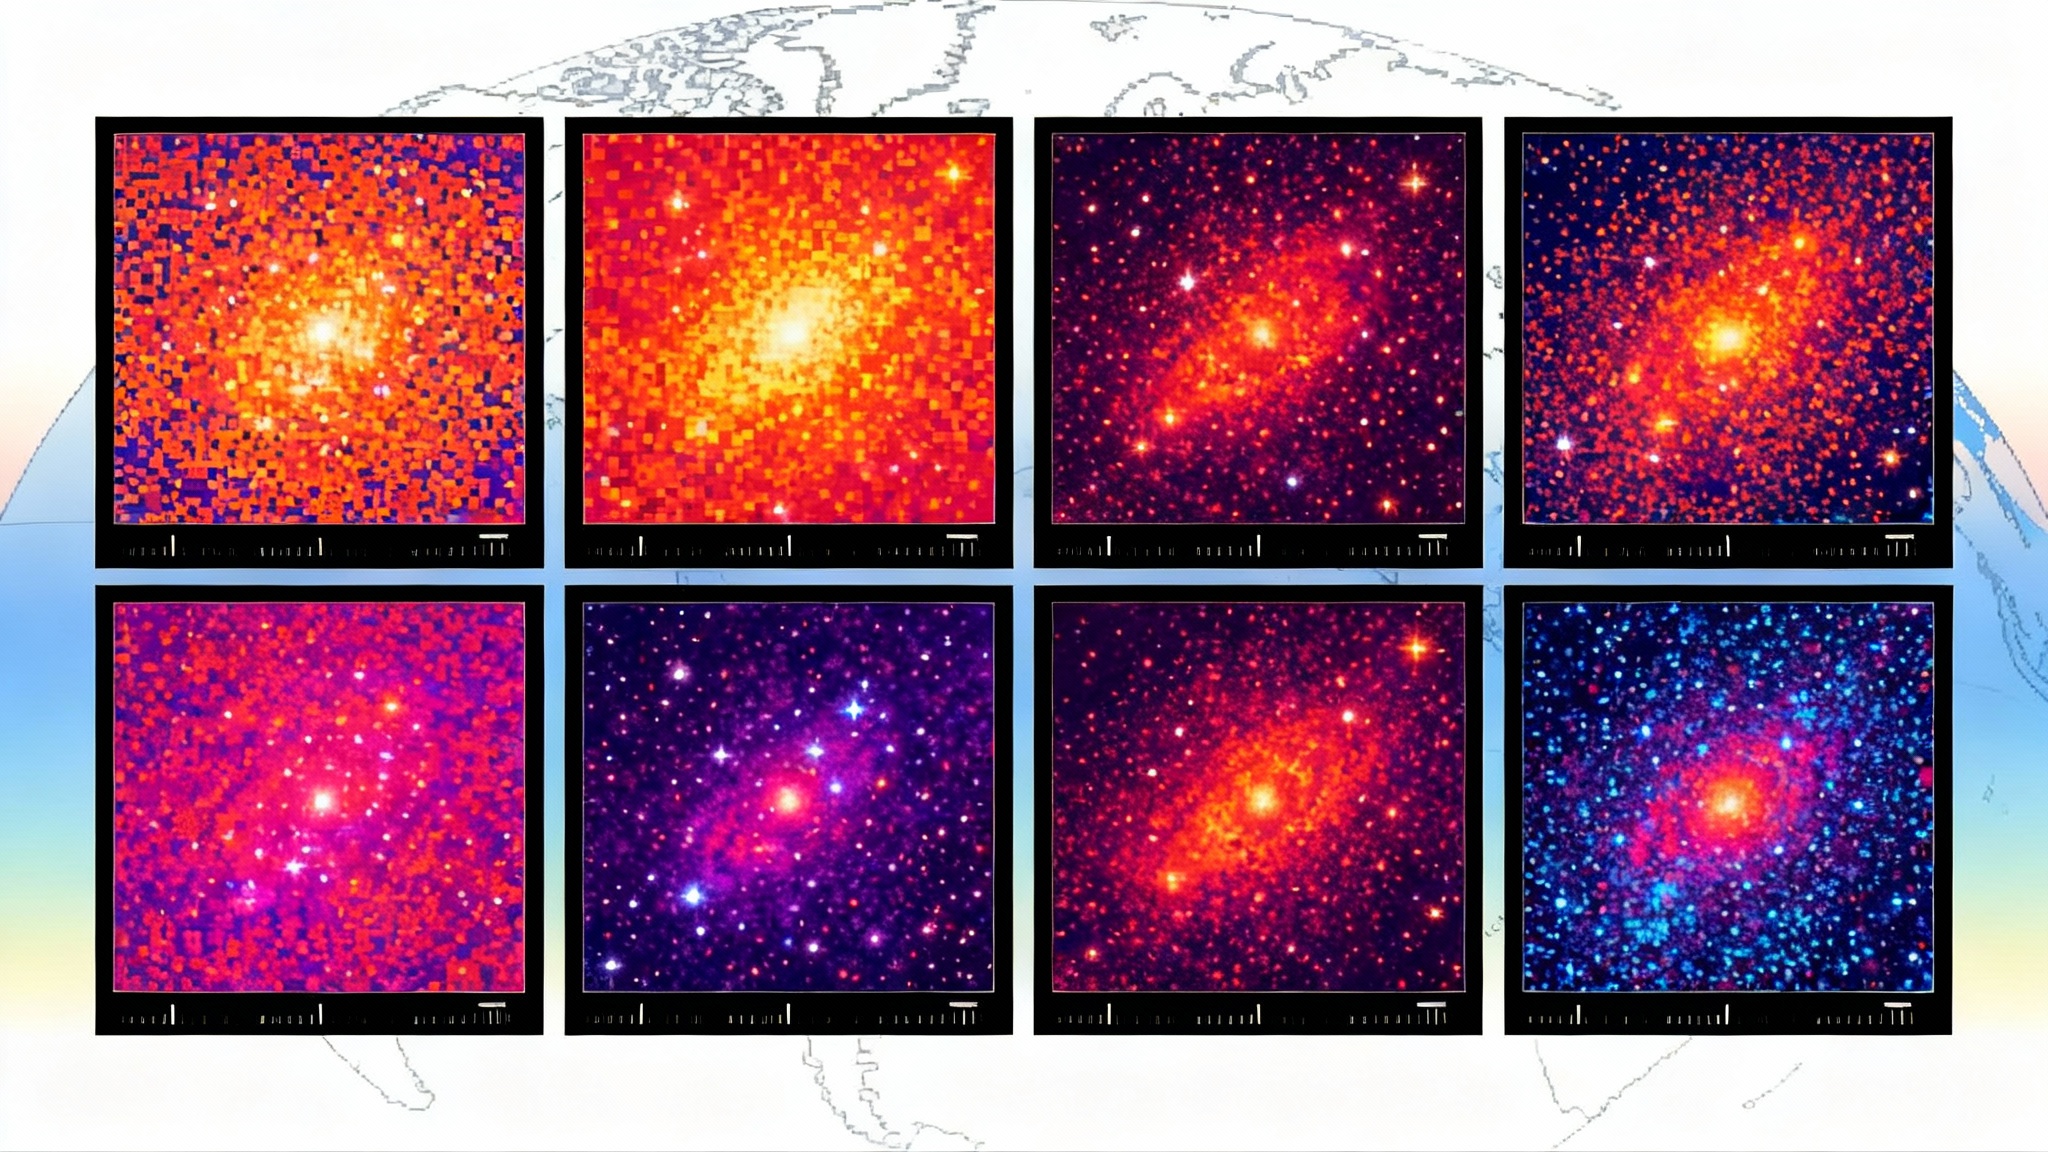
On March 11, 2025, a Falcon 9 lifted SPHEREx into orbit. Within weeks the observatory opened its eyes on the universe and returned its first images, six panels per exposure, each panel a different slice of infrared color. Those first frames, captured March 27 and shared April 1, were not yet calibrated for science, but they demonstrated that the detectors, optics, and survey cadence were working as designed. See the mission’s update on SPHEREx first images and status.
By May 1, SPHEREx had begun routine science operations. The survey proceeds as a daily rhythm of about 600 exposures, producing roughly 3,600 detector images across six sensors. The telescope will sweep the entire sky every six months, repeating this map four times during its two-year prime mission to build depth, check consistency, and catch time-variable phenomena.
What makes SPHEREx different
Think of most telescopes as zoom lenses that pick a handful of targets and study them in detail. SPHEREx is a panoramic color scanner. It observes in 102 near-infrared bands from about 0.75 to 5.0 microns, enough to separate the faint fingerprints of water ice, carbon dioxide, carbon monoxide, and complex carbon molecules in space. Rather than using a traditional spectrograph with moving gratings or prisms, SPHEREx carries linear variable filters fixed directly above its six detectors. The spacecraft steps its pointing in small increments so that each source slides across the filter and leaves a tiny spectrum, one narrow color at a time. The method is simple, robust, and fast, which is exactly what an all-sky survey needs.
Two engineering choices make this possible. First, an 11 by 3.5 degree field of view allows SPHEREx to cover large swaths of sky in few pointings. Second, passive cooling keeps the detectors cold enough to see faint infrared light without wasting power on cryocoolers. The result is a daily torrent of uniform, multicolor data from a stable system with no moving parts after launch.
The milestone that matters now
The first images matter because they flip the mission from planning to doing. With detectors behaving on orbit, the team can ramp up the calibration pipeline, tune the pointing steps that stitch spectra, and validate how the survey strategy handles bright stars, cosmic rays, and the sea of zodiacal light. Those early frames also show the instrument can detect the needle-in-a-haystack signals the mission was built for, like the 3.1 micron signature of water ice in star-forming clouds and the 4.27 micron signature of carbon dioxide in comet comae. As calibration tightens, the same 102-color snapshots will begin to yield quantitative maps and catalogs rather than only images.
Three ways SPHEREx will surface new targets fast
1) Primordial physics from galaxy clustering
SPHEREx is built to test ideas about what happened in the first instant after the big bang, when the universe expanded faster than light can travel. Tiny quantum fluctuations were stretched to cosmic scales and seeded the web of galaxies we see today. If that initial process was perfectly simple, the pattern of galaxy clustering on the largest scales should be almost perfectly Gaussian. If it was more complicated, subtle non-Gaussian features should appear. SPHEREx will look for those signatures by mapping the positions and distances of hundreds of millions of galaxies across essentially the full sky, then measuring how galaxy clustering depends on scale and color-based distance. That dependence places limits on the primordial non-Gaussianity parameters that distinguish single-field from multi-field inflation models.
The practical upshot is immediate triage. As soon as the first half-sky map is calibrated, teams can run large-scale clustering analyses to search for deviations that warrant deeper scrutiny. Targets of interest here are not single objects, but regions and redshift ranges where the clustering signal looks unusual or where cross checks with external datasets sharpen the measurement. Expect synergy with surveys like Euclid open-universe map.
2) A census of water and organics in our stellar neighborhood
Between 0.75 and 5.0 microns, the spectrum carries famous features. Water ice leaves a broad absorption near 3.1 microns. Carbon dioxide near 4.27 microns. Carbon monoxide near 4.67 microns. Polycyclic aromatic hydrocarbons, the soot-like molecules that light up dusty regions, stand out near 3.3 microns. SPHEREx will scan these features toward millions of background stars shining through nearby molecular clouds. That turns the mission into a cartographer of ices, revealing where the ingredients of comets and future planets are stored and how those reservoirs move and change as stars and disks evolve. For active objects, the mission’s bands straddle volatile fingerprints that can suggest whether a comet’s chemistry was shaped in deep-freeze conditions or in warmer phases. For broader context on interstellar visitors, see 3I/ATLAS shared observatory.
3) Instant cross-match wins for follow ups
An all-sky survey that repeats every six months is a matching engine as much as a telescope. The data flow allows near real-time cross matching with catalogs from Gaia, WISE, 2MASS, and ground-based surveys. The result is fast triage lists for many communities. Transient teams will pull out dusty novae and supernovae based on their red colors. Exoplanet disk hunters will flag young stars with unusually strong ice features or hydrocarbons. Small body specialists will identify comets with atypical carbon dioxide to water ratios. Because SPHEREx delivers uniform coverage, those lists will not be biased to particular patches of sky, and because it returns repeatedly, teams can watch how the signatures change with time.
Why this survey accelerates discovery rather than repeats it
SPHEREx does not aim to out-resolve the James Webb Space Telescope or outpace Rubin’s nightly optical cadence. It complements them. The telescope’s power lies in uniform, multicolor spectroscopy at low resolution over the full sky, repeated like clockwork. That combination has been missing. It turns broad theoretical questions into practical target lists. In cosmology it supplies the gigantic, all-sky galaxy samples where the largest-scale clues are strongest. In astrochemistry it supplies the ice maps that tell us which clouds and which star-forming filaments are most interesting right now. In time-domain work it points observers toward rarities while those objects are still evolving. For time-domain synergy, compare with Rubin's first images ignite.
Because SPHEREx data are open by design, the long tail of discovery widens. NASA has committed to placing observations into the public archive within about 60 days of collection, then updating it regularly. The first quick-release products appeared in July 2025, and weekly deliveries continue as the pipeline matures. A complete all-sky map across all 102 colors is planned after the first year of operations, setting the stage for early high-impact papers in 2026 and a flood of refined results through 2027. Explore the SPHEREx open data gateway.
What to watch in the next 6 to 18 months
- First uniform half-sky catalogs. Expect initial photometric redshift catalogs and large-scale clustering measurements soon after the first six-month pass is fully calibrated and validated. These early catalogs will stress test systematics such as stellar contamination, Galactic dust corrections, and variations in zodiacal light.
- A map of ices in nearby star-forming regions. Focus regions include Orion, Vela, Perseus, Taurus, and the Chamaeleon complex. The aim is to publish absorption strength maps for water, carbon dioxide, and carbon monoxide that can be combined with radio and submillimeter emission maps to derive ice-to-gas ratios and how those ratios vary with environment.
- Comet chemistry watchlist. Expect rapid-look notes on unusual comets whose spectra show strong carbon dioxide despite modest water, or vice versa. For an interstellar benchmark, cross-compare against results compiled in our related coverage above.
- Cross-mission synergy papers. You will see SPHEREx maps paired with weak-lensing shear catalogs, radio surveys of neutral hydrogen, and microwave background lensing maps. The goal is to break degeneracies that limit any single data set. When measurements agree across wavelengths, the systematics budget tightens and the inflation constraints improve.
- First-year all-sky mosaic. Around the one-year mark, the team plans to release a full-sky mosaic in all 102 bands, along with documentation and examples that show how to reproduce figures and build custom subsets.
How the data flow will actually work
SPHEREx is managed by the Jet Propulsion Laboratory for NASA’s Astrophysics Division. Caltech oversaw the instrument integration. BAE Systems in Boulder built the telescope and spacecraft bus. Data processing and archiving run through the Infrared Science Archive at IPAC. The pipeline ingests raw detector frames, flags instrumental artifacts, calibrates the per-band response using standard stars and on-orbit checks, stitches the linear variable filter steps into per-source spectra, assigns coordinates to a common astrometric grid, and builds per-band maps and per-object catalogs. The archive then releases quality-controlled products on a rolling basis, with the aim of pushing observations to the public within about two months.
For scientists, the key is that the products arrive in familiar forms. You will find per-band images, per-band depth maps, catalogs of source properties including fluxes, spectral indices, and photometric redshifts with uncertainties, and cutout services to extract small regions around your targets. For educators and advanced amateurs, the barrier to entry is deliberately low. Example notebooks show how to download a sky patch, visualize the 102-color cube, and compute simple spectral indices.
Practical ways to use SPHEREx immediately
- Build a nearby cloud ice map. Pick a star-forming region visible from your latitude. Query the catalog for background stars with high signal-to-noise in the 3.1 micron band. Measure the depth of the water ice absorption along each sightline. Plot those values against sky position to outline where the densest, coldest pockets sit. Compare the result with a radio map of carbon monoxide to see how ice and gas relate.
- Triage comets for follow up. For known comets, extract the 3.3, 4.27, and 4.67 micron bands across a small moving aperture that follows the ephemeris. A strong 4.27 micron line relative to 3.1 microns points to a carbon dioxide rich coma. Share those ratios with observers who have spectrographs on small and medium telescopes so they can plan higher-resolution measurements.
- Hunt for rare dusty transients. Cross match SPHEREx sources with optical transients reported by time-domain surveys. Prioritize objects with rising flux at 3 to 5 microns, which can indicate newly formed dust or heavy reprocessing of starlight. These are prime targets for follow-up spectroscopy.
- Test large-scale clustering. Use the half-sky catalogs to measure the angular power spectrum in broad redshift bins. Compare with predictions under different inflation scenarios. Even a null result is a constraint, and the early pipeline will benefit from independent cross checks of systematic corrections.
Why the pace should pick up from here
Surveys accelerate discovery when they remove friction. SPHEREx removes three types at once. It removes targeting friction by observing everything. It removes interpretive friction by providing spectra rather than single-color images. It removes coordination friction by publishing uniform data quickly and repeatedly. That is why the first images matter. They confirm the machine is on, the pipeline is working, and the clock on rapid releases has started. As the first-year mosaic lands and teams fold SPHEREx into their daily workflows, expect a pattern to repeat. The survey will surface a target, another observatory will dive deep, and a new piece of the cosmic story will click into place.
The sky did not change in 2025. Our instrument did. The moment SPHEREx went live, we added 102 new ways to read it, and that is how discovery speeds up.