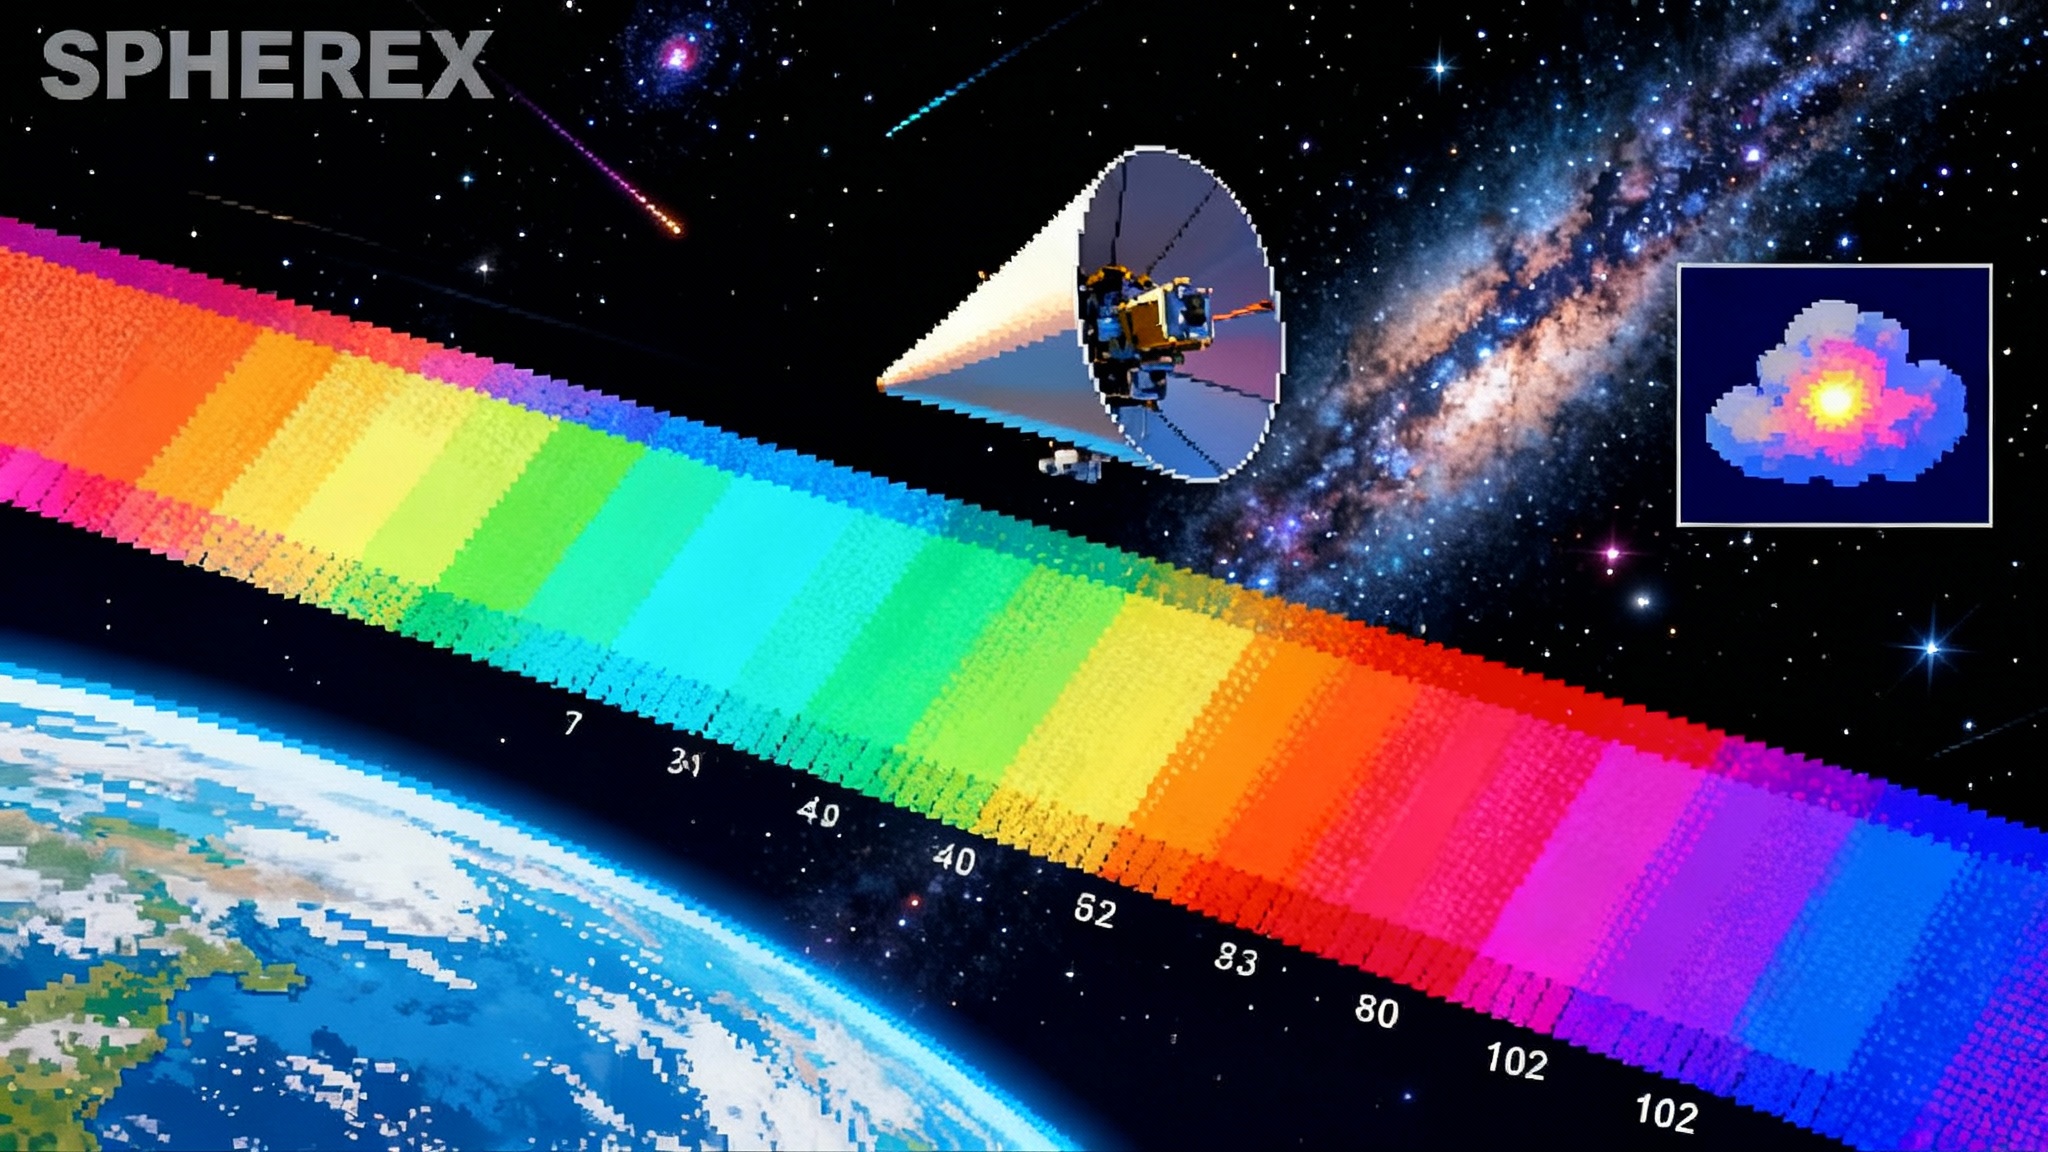
SPHEREx Is Live: Inside NASA’s 102-color Map of the Sky
Launched March 12, 2025 UTC and now scanning in 102 infrared colors, SPHEREx has moved from first light into weekly public data drops. See what to watch next and how to tap the data for inflation tests, a Milky Way ice census, and target lists for Webb and Roman.
Breaking through: the 102-color sky goes operational
On March 11, 2025 Pacific Time, which was March 12, 2025 in Coordinated Universal Time, a SpaceX Falcon 9 lifted off from Vandenberg carrying NASA’s SPHEREx observatory. Two weeks later, the mission captured its first in-space images. On May 1, 2025, SPHEREx began routine science operations that will tile the entire sky with spectra, not just pictures. NASA confirmed the start of that phase with a look at early scenes in one band and in many, noting the mission is taking about 3,600 images per day across 102 infrared wavelengths. You can read NASA’s description of that handoff to full science mode in an article on how SPHEREx begins capturing the entire sky.
In July 2025 the flow of public data started. The first Quick Release products landed in the Infrared Science Archive run by Caltech’s IPAC. Those early products are image-like spectral frames, refreshed weekly as the pipeline improves. IRSA’s plan and cadence are laid out in its IRSA Quick Release overview. That is the second link in this story and our guide for how the next two years will unfold for anyone who wants to analyze this firehose.
Here is why this moment matters and what to watch between now and late 2026.
Why 102 colors change the rules
A normal sky survey takes a few broad filters and paints the sky in those tones, like taking a city photo in red, green, and blue. SPHEREx uses linear variable filters and six detectors to turn each image into a small spectrum. Imagine scanning that same city with a prism so you see not just lights but the gas neon signs are made of, the sodium lamps on highways, and the carbon dioxide wisps from heat vents. With SPHEREx, a single exposure returns six detector images, each sensitive to different parts of 0.75 to 5.0 microns. Stack many exposures as the spacecraft sweeps across the sky and you build a spectral cube for every point.
Practical details matter for anyone thinking of mining the data:
- Field of view is roughly 3.5 by 11.5 degrees, about 20 times the Moon’s width.
- Around 600 exposures are taken per day, six detector images per exposure, which yields about 3,600 images per day.
- The mission’s planned two-year survey maps the entire sky four times, which means time-domain comparisons and repeated passes for improved calibration.
- The archive will ultimately include hundreds of millions of sources with spectral fingerprints, plus deep fields and calibration regions that will be valuable for algorithm testing.
The result is a different kind of atlas. It is a map where every pixel comes with a barcode. That barcode can tell you the distance to a galaxy, whether a star’s light is reddened by dust, or whether an invisible layer of water ice coats the dust grains in a cold cloud.
The next 12 to 24 months: what to watch
Between now and late 2026, three milestones will reshape how astronomers plan follow-up and how small teams can contribute.
1) First constraints on cosmic inflation from all-sky spectra
What it is: The physics of inflation describes a burst of expansion in the earliest fraction of a second after the big bang. That event left subtle fingerprints in how galaxies cluster on the largest scales. SPHEREx will map those scales with three ingredients that have been missing in one package: full-sky coverage, redshift information from low-resolution spectra, and repeated passes that suppress striping and systematics.
What to expect: The first useful cosmology products tend to lag raw images by several months. The July 2025 Quick Releases contain spectral images suitable for testing pipelines. By late 2025 and early 2026, teams will combine passes to build the first uniform large-scale maps in dozens of wavelengths. Expect early papers in 2026 that focus on two measurements most sensitive to inflation physics:
- The shape of galaxy clustering on very large angular scales, where any scale-dependent bias betrays primordial non-Gaussianity.
- Cross correlations between SPHEREx intensity maps and legacy microwave background maps to test whether the same large-scale pattern appears in both.
Why it matters: A tight constraint on primordial non-Gaussianity tells you whether simple single-field models of inflation are viable or if more complex multi-field physics is required. You will see limits expressed as bounds on a parameter called f_NL, sometimes accompanied by related parameters like g_NL and tau_NL. Because SPHEREx sees such huge volumes of space, its leverage on these parameters will be stronger than any past all-sky spectroscopic survey at low redshift. The first numbers will be conservative, then sharpen as calibrations converge.
How to read the first results: Look for three sanity checks in papers and preprints. First, do the constraints hold when masking bright stars and the Galactic plane more aggressively. Second, do they persist across independent halves of the sky. Third, do foreground models for zodiacal light and diffuse dust pass null tests that scramble phases while preserving power spectra. If you see agreement across those tests, you are looking at robust cosmology.
2) A Milky Way water-ice census at scale
What it is: SPHEREx spans diagnostic features for water, carbon dioxide, and carbon monoxide ices. The 3.0 micron band for water ice is the headline, with additional features near 4.27 microns for carbon dioxide and 4.67 microns for carbon monoxide. Because SPHEREx scans the entire plane of the Milky Way repeatedly, it will trace where these ices live on dust grains inside molecular clouds and in young planetary systems.
What to expect: Pilot maps in 2025 and early 2026 will highlight a handful of well studied star-forming regions. Then the coverage blossoms into a plane-wide atlas. By mid 2026 you should see catalog papers that publish sightline-by-sightline optical depth maps for the major ice features. The immediate payoff is a spatial recipe for where water and other biogenic ices accumulate before planets form. This provides boundary conditions for models of how much water rocky planets can inherit.
How to read the first results: Seek cross checks against targeted spectra from ground-based infrared telescopes and against dark cloud tracers like carbon monoxide radio maps. If the SPHEREx ice depths track those independent maps but reveal additional structure near embedded protostars, you are seeing the survey’s unique value.
3) Target lists for Webb and Roman
What it is: SPHEREx is the scout. It flags phenomena that require zoom-in spectroscopy or high-contrast imaging from flagship telescopes. The James Webb Space Telescope will take those flags and resolve the chemistry in disks and the detailed redshift structure in distant galaxies. The Nancy Grace Roman Space Telescope, targeted for launch no later than May 2027, will supply wide-field depth and strong lensing statistics that pair well with SPHEREx redshift estimates.
What to expect: Starting in late 2025, watch for shortlists of oddball spectra: sources with unusually deep ice features, galaxies with extreme polycyclic aromatic hydrocarbon emission around 3.3 microns, or transient changes between the first and second all-sky passes. Those lists are the seeds of Webb follow-up. By 2026, as Roman’s survey tiling and community programs lock in, SPHEREx maps will be used to preselect patches with clean foregrounds and rich structures for Roman’s high-latitude surveys.
How to read the first results: Webb papers that cite SPHEREx as the discovery engine will usually include cutout spectra from the survey as context. Roman planning documents will reference SPHEREx when discussing photometric redshift training and the mitigation of low-level systematics in wide-field shear measurements.
Open data and AI will let small teams ride the wave
SPHEREx is not just a mission for large collaborations. The archive is open, the cadence is fast, and the data are designed to be mined.
- Weekly flow of data: IRSA’s Quick Release program began in July 2025 and is releasing spectral images weekly. The archive then reprocesses those frames as calibrations improve, so the same sky region will get better over time. The first year’s reprocessed set began rolling out in the fall of 2025, with additional tools arriving through 2026 and 2027.
- Tools that meet you where you are: IRSA’s Data Explorer for SPHEREx offers search, cutouts, and basic visualization. The Spectrophotometry Tool is designed to generate a pipeline-consistent spectrum from a user-selected spot on the sky. The Linear Variable Filter cutout tool and mosaic builder are staged to follow as the archive deepens. The spectral cube cutout service arrives after a full year of data.
- Cloud access: IRSA mirrors Quick Release holdings in the cloud, including on Amazon Web Services, which lowers the barrier to working at scale without downloading terabytes.
A lightweight AI workflow for a two-person team looks like this:
-
Pick a narrow science target. Examples: search for new cometary outgassing in the 3 micron water band off the ecliptic; find young stellar objects with unusually deep ice bands; flag galaxy clusters via spectral steps near 1 micron that indicate the 4000 Ångström break at specific redshifts.
-
Start with quick looks and cutouts rather than full mosaics. Use the spectral image cutout service on a grid to assemble a small labeled set of spectra and sky patches.
-
Build a baseline model. Use a simple autoencoder or principal component analysis to compress spectra, then score residuals to rank anomalies. For classification tasks, begin with a small random forest on hand-engineered features such as continuum slope and band depths, or a shallow convolutional network on small spectral image stamps.
-
Inject realism. Augment training with noise drawn from real backgrounds. Rotate and jitter cutouts to catch scanning geometry effects. Mix in synthetic signals at physically plausible depths to calibrate your thresholds.
-
Validate against external catalogs. Cross match your candidates with Gaia for stellar types, AllWISE for thermal colors, and known comet ephemerides. Expect tens of percent contamination in early runs. Tighten with simple vetoes such as proximity to bright stars or the Galactic midplane for extragalactic searches.
-
Share and iterate. Post your ranked lists with basic metrics: sky area searched, depth at which you are 50 percent complete for a given line depth, contamination estimates. This makes your work reusable by larger programs.
Citizen science teams can participate by triaging anomaly lists. Human eyes are still excellent at spotting artifacts versus real extended structure. A small group can classify thousands of candidates per week and feed high-quality labels back into machine learning loops.
What could go wrong and how to watch for it
Every all-sky mission battles systematics that masquerade as signals. Here are the practical ones to track in 2025 and 2026 and how they are likely to be handled:
-
Zodiacal light. Sunlight scattered by interplanetary dust creates a smooth glow that varies with solar elongation and time. Expect models that fit and subtract a slowly varying component using repeated passes at different angles. Watch that inflation papers show results with multiple zodiacal models.
-
Stray light and ghosts. Bright stars can produce internal reflections. Look for mask maps and catalogs of affected regions. Good papers will present measurements with and without those regions.
-
Wavelength calibration drift. Temperature changes can tiny-shift the effective wavelength of linear variable filters. The pipeline pins these drifts using sky lines and stable stellar standards. For any feature measured near a band edge, robust results will demonstrate insensitivity to small wavelength shifts.
-
Point spread function variations. The shape of the instrument’s response varies across the large field. If a claimed detection depends on marginally resolved structure, it should include a demonstration that it holds after homogenizing to a common resolution.
For broader heliospheric context that complements zodiacal modeling and time-variable backgrounds, see our look at how IMAP heliosphere weather map science will unfold.
A short field guide to SPHEREx data products
If you are opening SPHEREx files for the first time, here is what to expect over time and how to use them well:
- Quick Release spectral images. These are the weekly workhorses. They support cutouts and simple spectra extraction. Use them to prototype algorithms and build candidate lists.
- Reprocessed Quick Release sets. These arrive as calibrations improve and should replace earlier versions in serious analyses. Differences between versions are a feature, not a bug. They quantify calibration progress.
- Spectrophotometry on demand. The Spectrophotometry Tool will output pipeline-consistent 102-color spectra at any position. Use it to verify that your custom extractions are not biased.
- Mosaic and cube services. As year one completes, the archive adds cube cutouts and large mosaics. Use mosaic services for population studies across extended clouds or clusters, and reserve pixel-scale cubes for detailed spectral fitting in small fields.
A sensible workflow is to start with Quick Release images and the spectrophotometry service for nearby validation, then graduate to mosaics and cubes for your publication-ready analysis.
What this unlocks for Webb, Roman, and beyond
The real power of a survey like SPHEREx comes from how it changes what we point our sharpest telescopes at, and when. Here is a practical reading of the handoffs:
-
For JWST: SPHEREx identifies outliers. Webb dissects them. If SPHEREx flags a newborn star with abnormally deep water and carbon dioxide ice bands, Webb can take a high-resolution spectrum to measure ice mixtures, temperatures, and gas phase species. For a sense of how JWST follow-ups translate into breakthroughs, see when JWST spots a cold Saturn.
-
For Roman: SPHEREx tells you where the cosmology is clean. Roman’s weak-lensing and galaxy redshift surveys need regions with low diffuse light contamination and well understood photometric redshifts. SPHEREx provides both by mapping diffuse emission and pinning down large-scale structure. In some cases, SPHEREx will preselect voids and clusters with spectral confirmation, sharpening Roman’s cosmology.
-
For ground-based surveys: SPHEREx delivers redshift priors and dust corrections that improve photometric redshifts in Rubin Observatory data and sharpen line emitter searches in narrow-band programs. For the coming ground-based surge, see how Rubin is poised in Rubin’s 2026 discovery wave.
-
For planetary and Solar System work: Repeated all-sky passes catch time-variable phenomena near the ecliptic and in the outer Solar System. Expect catalogs of serendipitous comets, dust trails, and moving objects with unusual spectral slopes.
How to get started in one afternoon
-
Pick a sky patch you know well. A famous molecular cloud, a rich cluster, or a deep extragalactic field. Familiarity makes it easier to spot artifacts and surprises.
-
Pull a grid of small spectral cutouts from the archive rather than a giant mosaic. You will get to first plots faster and avoid premature optimization.
-
Plot three bands that span a feature of interest. For water ice, try constructing a simple index that compares flux inside the 3.0 micron band to flux on either side. Map that index over your cutouts and see what pops.
-
Cross match your detections with published catalogs and with your own prior knowledge. The fastest way to build confidence is to rediscover something known, then push just beyond it.
-
Share your notebook and your failure modes. The SPHEREx archive improves quickly. Others will help you patch the pitfalls you document.
The moment
SPHEREx did not arrive quietly. It launched on March 11 Pacific Time, started science operations on May 1, and began weekly public releases in July. The mission’s promise is not a single splashy image. It is a living, color-rich ledger of the sky that grows every week. Over the next two years, it will test ideas about the first instant of time, count water ice in places where planets are born, and hand our best telescopes a smarter to-do list. The rest is opportunity. The data are open. The tools are catching up. If you have a laptop, a question, and a few evenings to spare, you can be part of what SPHEREx changes.