Hydrogen After the Cuts: Where Projects Still Pencil
DOE’s October cancellations ended the hub-first era. Here is a practical map of where hydrogen projects still work under 45V, which offtakes are real, and how to structure power and finance to survive 2030’s hourly matching.

The October shock, and the pivot that followed
On October 2, 2025, the Department of Energy canceled billions in previously announced clean energy awards, including funding tied to proposed hydrogen hubs in California and the Pacific Northwest. Reuters reported the cancellations, and the signal was clear. The era of hub-led hydrogen is giving way to market-led hydrogen that must pencil on its own terms.
That new reality runs straight through the Internal Revenue Service’s Section 45V clean hydrogen production tax credit, finalized earlier this year. The rules determine whether a kilogram earns a small incentive or the full three dollars, and they quietly dictate where and how developers should build. See the IRS final regulations for Section 45V for the core structure, from eligibility across electrolysis and methane with carbon capture to lifecycle emissions thresholds.
45V is now the playbook
The finalized 45V rule keeps three pillars for clean power used in electrolysis. Understanding them in practical terms is the difference between a project that clears investment committee and one that never leaves a slideshow.
-
Incrementality means the electricity attributed to hydrogen production comes from new clean capacity, generally brought online within 36 months of the hydrogen facility’s start date. Limited flexibilities, such as at‑risk nuclear or generators that recently added carbon capture, reduce grid backsliding risk while avoiding multi‑year interconnection delays for every project.
-
Deliverability means the clean megawatt hours you claim must be from the same grid region as the electrolyzer, typically defined by balancing authority. Treat that map like a zoning code for your business model. It decides which plants you can count, which hedges will work, and how much congestion and basis risk you must manage. For the grid context that underpins this, see Transmission’s make-or-break year.
-
Temporal matching means the clean electricity and the electrolyzer load must align in time. Annual matching is permitted until January 1, 2030, then the requirement moves to hourly matching. That two‑step buys time to commission new generation and storage, stand up hourly certificate tracking, and run electrolyzers at bankable capacity factors, while making clear that by 2030 hydrogen cannot rely on average annual greenness.
Credit value still scales by lifecycle carbon intensity. The cleanest band can reach three dollars per kilogram, and higher‑intensity tiers receive less. In practice, those tiers are not just a bonus. They separate a delivered price near five dollars per kilogram from a price that pushes hydrogen out of reach for most end uses.
Where electrolyzers make sense now
Private capital will flow where three things line up: cheap and verifiably clean electricity with a path to hourly matching, a strong nearby buyer willing to sign a real offtake, and logistics that keep delivery costs down.
-
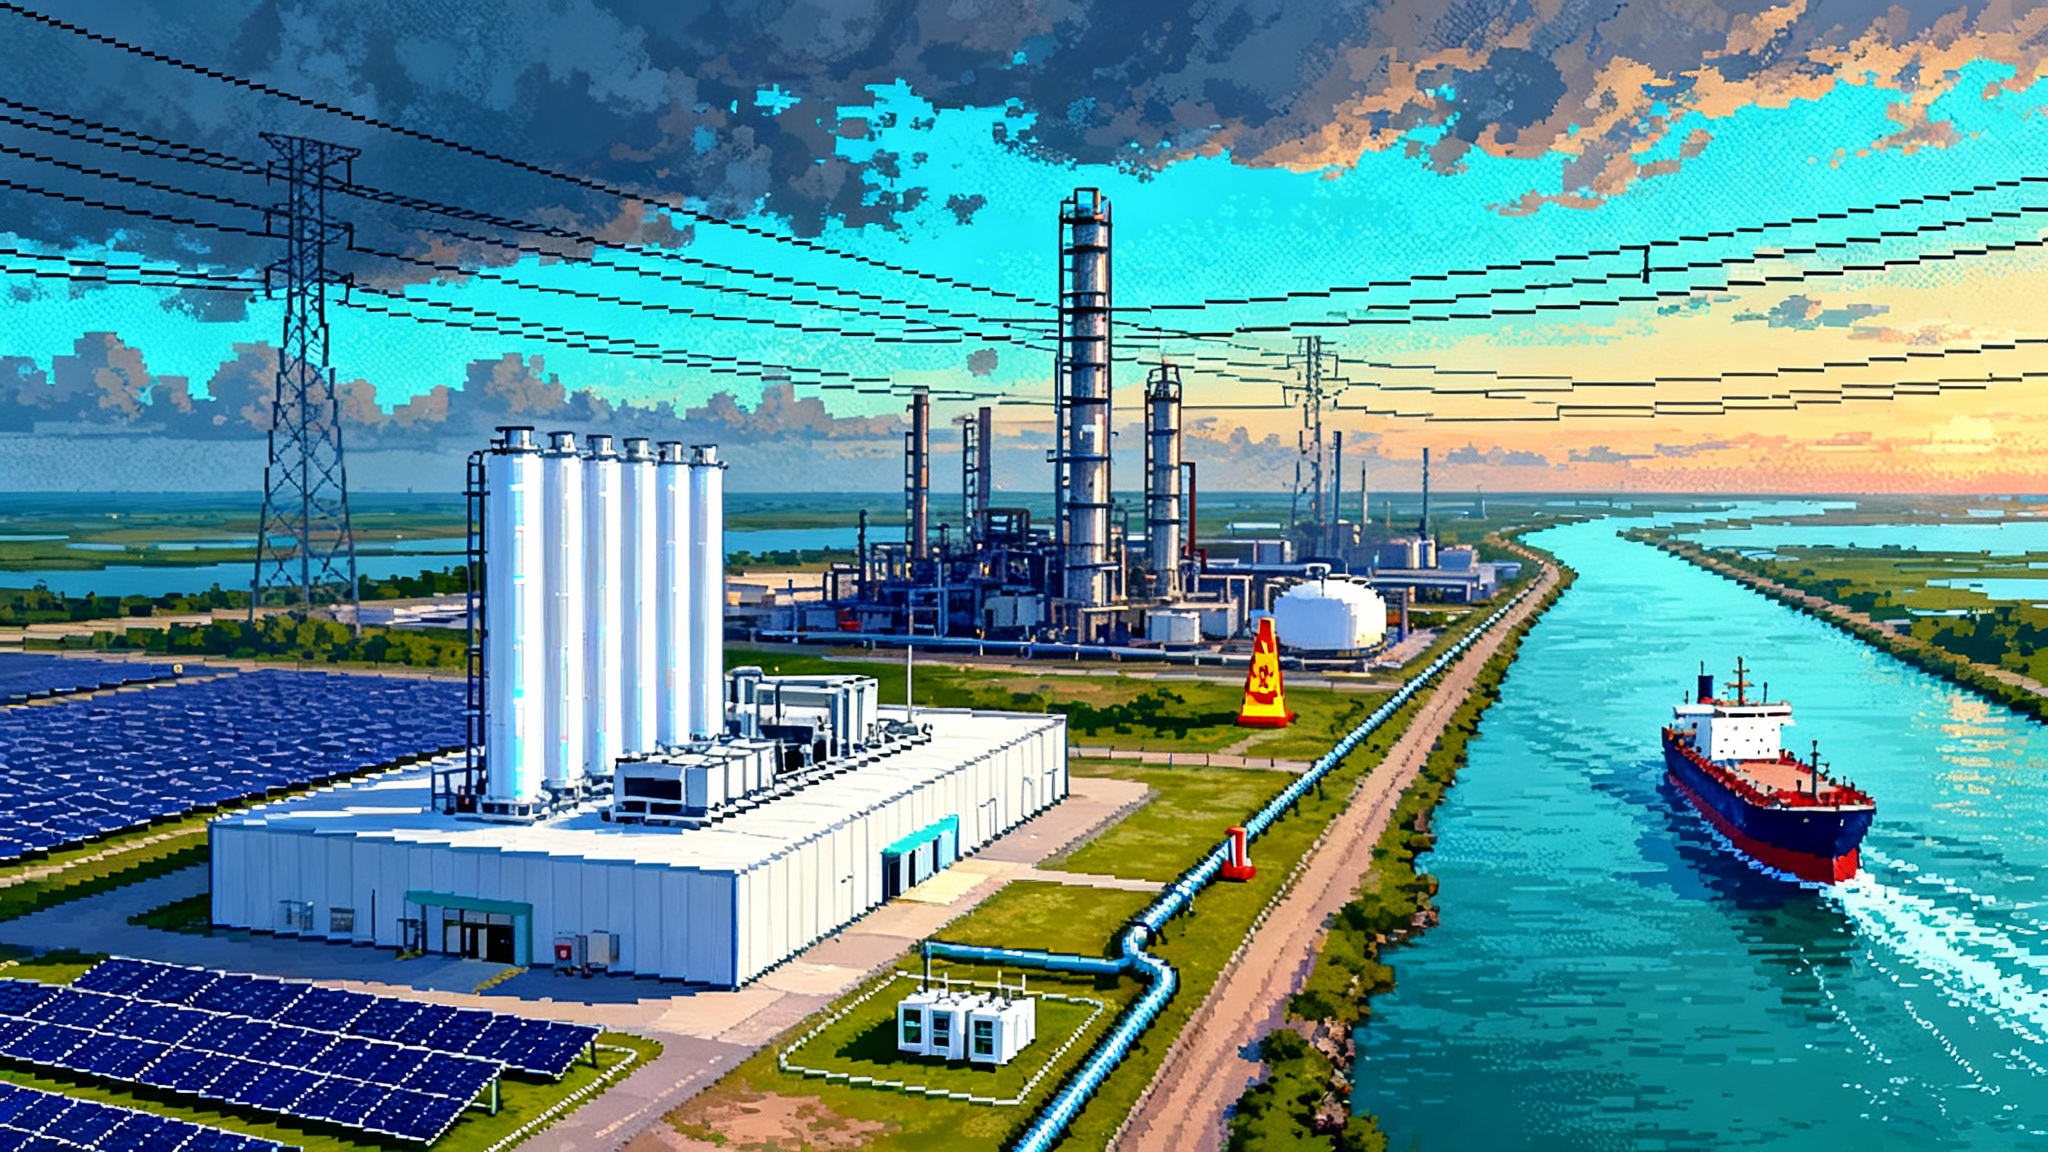
Texas Gulf Coast. Very low cost wind and solar pair with a massive industrial hydrogen sink in refineries and petrochemical plants, plus existing hydrogen pipelines and salt cavern storage. Deliverability is straightforward because power and electrolyzers can sit inside the same balancing authorities. Hourly matching by 2030 is manageable with co‑located solar, onshore wind, and batteries. Ports open an ammonia export route if local demand saturates.
-
Midwest wind belt. Iowa, Nebraska, and parts of the Dakotas offer high capacity factor wind, large fertilizer markets, and rail access that keeps ammonia logistics reasonable. Co‑located electrolyzers with new wind and storage can run at robust capacity factors while meeting incrementality. Seasonal wind swings before 2030 point to storage sizing and flexible offtake that tolerates variable monthly volumes.
-
Pacific Northwest. Hydropower and a lower grid carbon intensity create a compelling emissions profile. Even after October’s hub cancellations, electrolyzers near aluminum smelters, ports, or data center growth can source clean power with fewer tradeoffs. The gating item is offtake firmness rather than electrons. Freight corridors to Asia for ammonia help, but buyers must specify volumes and conversion assets. For load competition and siting pressure, see AI’s power crunch.
-
California. Refineries are large, local hydrogen buyers and the Low Carbon Fuel Standard adds a revenue leg for mobility. The policy stack can support heavy truck corridors out of the ports and airport fueling. Challenges are electricity pricing and interconnection timing. To make 45V work at scale by 2030, developers will need time‑matched power from new clean plants or storage and contracts that keep electrolyzers at high capacity factors.
-
Appalachia and the Gulf for methane with carbon capture. For blue hydrogen, the model depends on low methane leakage, high capture rates, and access to Class VI storage. 45V does not exclude this pathway, but it forces real lifecycle math. Projects will move near refineries and ammonia plants where offtake is immediate and pipelines are close. A good blue project now looks like a pipeline replacement for grey hydrogen, not a speculative export terminal. For policy and leakage backdrop, compare U.S. and EU methane rules.
End uses that still pencil with private capital
-
Ammonia. The fertilizer market is a ready customer because it already converts hydrogen on site. Near‑term winners will be brownfield upgrades that swap part of the feed from grey to lower‑carbon hydrogen without rebuilding the whole site. Export‑oriented e‑ammonia can also work on the Gulf Coast and Pacific Northwest if offtakers are real, shipping schedules are fixed, and conversion assets are contracted. The delivered price math is unforgiving. A developer starting near two dollars per kilogram of hydrogen after the 45V credit still must add one to two dollars for compression, conversion, storage, and shipping. Any green premium must be explicit in the contract.
-
Refineries. This is the fastest‑moving industrial use because refineries already buy large volumes of hydrogen. The move is to displace grey hydrogen with on‑site or nearby lower‑carbon supply delivered through existing pipelines. Contracting looks like take‑or‑pay with volumetric floors and a price indexed to natural gas and power. 45V reduces the net price, but refiners will insist on reliability and impurity specs. Most green hydrogen projects will proceed only where a refinery creates a guaranteed baseload offtake.
-
Steel. In the United States the breakthrough is still early, but the logic is clear. Direct reduced iron paired with electric arc furnaces can start with hydrogen blending, then increase shares as supply costs fall. Projects will appear only where an integrated site can secure time‑matched clean power and avoid shipping iron units long distances. Expect memorandum‑of‑understanding volumes before firm commitments as Europe carries more of the early demonstration risk.
-
Heavy transport. Fuel cell trucks at ports, buses in fleet depots, and material handling at logistics hubs are the near‑term beachheads. The business model is hub‑and‑spoke, with centralized production feeding a handful of high‑throughput stations. The delivered price bar is well known. Five to six dollars per kilogram delivered at scale can win in drayage and bus fleets with high utilization, and California’s credit stack can help. Long‑haul viability hinges on station density and stack lifetimes that keep operating costs predictable.
The new project finance stack
Without hub grants, developers must build a financeable, auditable story around three things: the 45V credit, the time‑matched power contract, and the offtake.
-
The 45V credit. Value increases as lifecycle emissions fall, with a top tier at three dollars per kilogram for the cleanest hydrogen. The credit runs for ten years, and transferability opens a path to monetize it even if the sponsor lacks tax appetite. This creates a revenue floor for lenders and a measurement and verification duty for sponsors. If a project fails hourly matching in 2030, or misses deliverability, value falls quickly. Allocate that risk in loan agreements and EPC guarantees.
-
Time‑matched PPAs. Treat today’s annual matching window as a build runway, not a license to ignore hours. The smart structure blends solar, wind, and storage so the electrolyzer can run at a high capacity factor and still meet hourly matching by 2030. Virtual contracts alone will not cut it unless hourly‑timestamped certificates with balancing‑authority deliverability can be retired against the load. Model two numbers side by side: the electrolyzer’s projected annual capacity factor and the percentage of hours covered with qualifying certificates after 2030. The second number protects the credit.
-
The offtake. Banks and equity want firmness, not fanfare. The strongest contracts have three features: a real buyer with a credit rating, minimum volumes with make‑whole provisions, and a price formula tied to the buyer’s alternative cost. For refineries, that is the cost of grey hydrogen at the plant gate. For ammonia, it is an index blend of natural gas and ammonia prices at the destination. For transport, it is a pump price a fleet can underwrite against diesel and maintenance savings.
Think of the project as a three‑legged stool. If one leg wobbles, the other two must be stronger. A refinery offtake can cover for weaker hourly matching, for a while, if the developer has a clear plan to add storage and a second solar site. A flawless PPA cannot compensate for a soft buyer that can walk away after twelve months.
What to watch in the next 12 months
-
Offtake firmness. Track the share of contracted volumes that are take‑or‑pay with limited outs. Watch how many letters of intent convert to binding contracts with pricing formulas and penalties for nonperformance. The conversion rate will determine whether 2026 sees financial closes.
-
Grid carbon intensity by region. Several developers will claim low lifecycle emissions based on regional averages in 2025 and 2026. The real test arrives in 2030 when hourly matching applies. Track where new renewable and storage capacity actually interconnects inside the same balancing authority as electrolyzers. If interconnections slip, so will credit value.
-
Hourly certificate infrastructure. Markets need credible issuance, verification, and retirement of hourly certificates with clear rules for storage and interregional delivery exceptions. Look for registry upgrades in large balancing authorities, utility participation, and auditors willing to sign off on hourly claims in project finance deals. Delays here directly affect revenue.
-
Delivered dollars per kilogram. For green hydrogen to win in mobility and industrial displacement, delivered prices need to settle in a band end users can plan around. Watch the fully loaded price, not just production cost. That includes power, water, compression, liquefaction or conversion, trucking or pipeline fees, and station operations. The best early projects will publish or at least imply a stable delivered price backed by contracts.
-
Electrolyzer performance and supply. Nameplate efficiency and reliability are converging. What matters most for lenders is observed capacity factor on commercial fleets, the stack replacement interval, and the spare‑parts model. Marginal gains here can be the difference between a 1.8 dollar per kilogram production cost and 2.2, before credits.
-
Credit policy stability. The rules are final, but politics is not. Lock in emissions modeling assumptions early, document energy sourcing and matching strategies, and prepare for an adversarial audit. A clean audit file is as valuable as a transformer.
The shape of real projects after the hub era
The cancellation of hub awards created a new filter. It stripped away the presumption that a grant can fill every gap and revealed which sites can stand on their own. The next wave looks like this.
-
Brownfield first. Projects that bolt onto existing ammonia plants and refineries, or that replace grey molecules in existing pipelines, will move first. They are closer to the customer, logistics are known, and engineering scope is smaller. Every unknown you remove lowers the return hurdle.
-
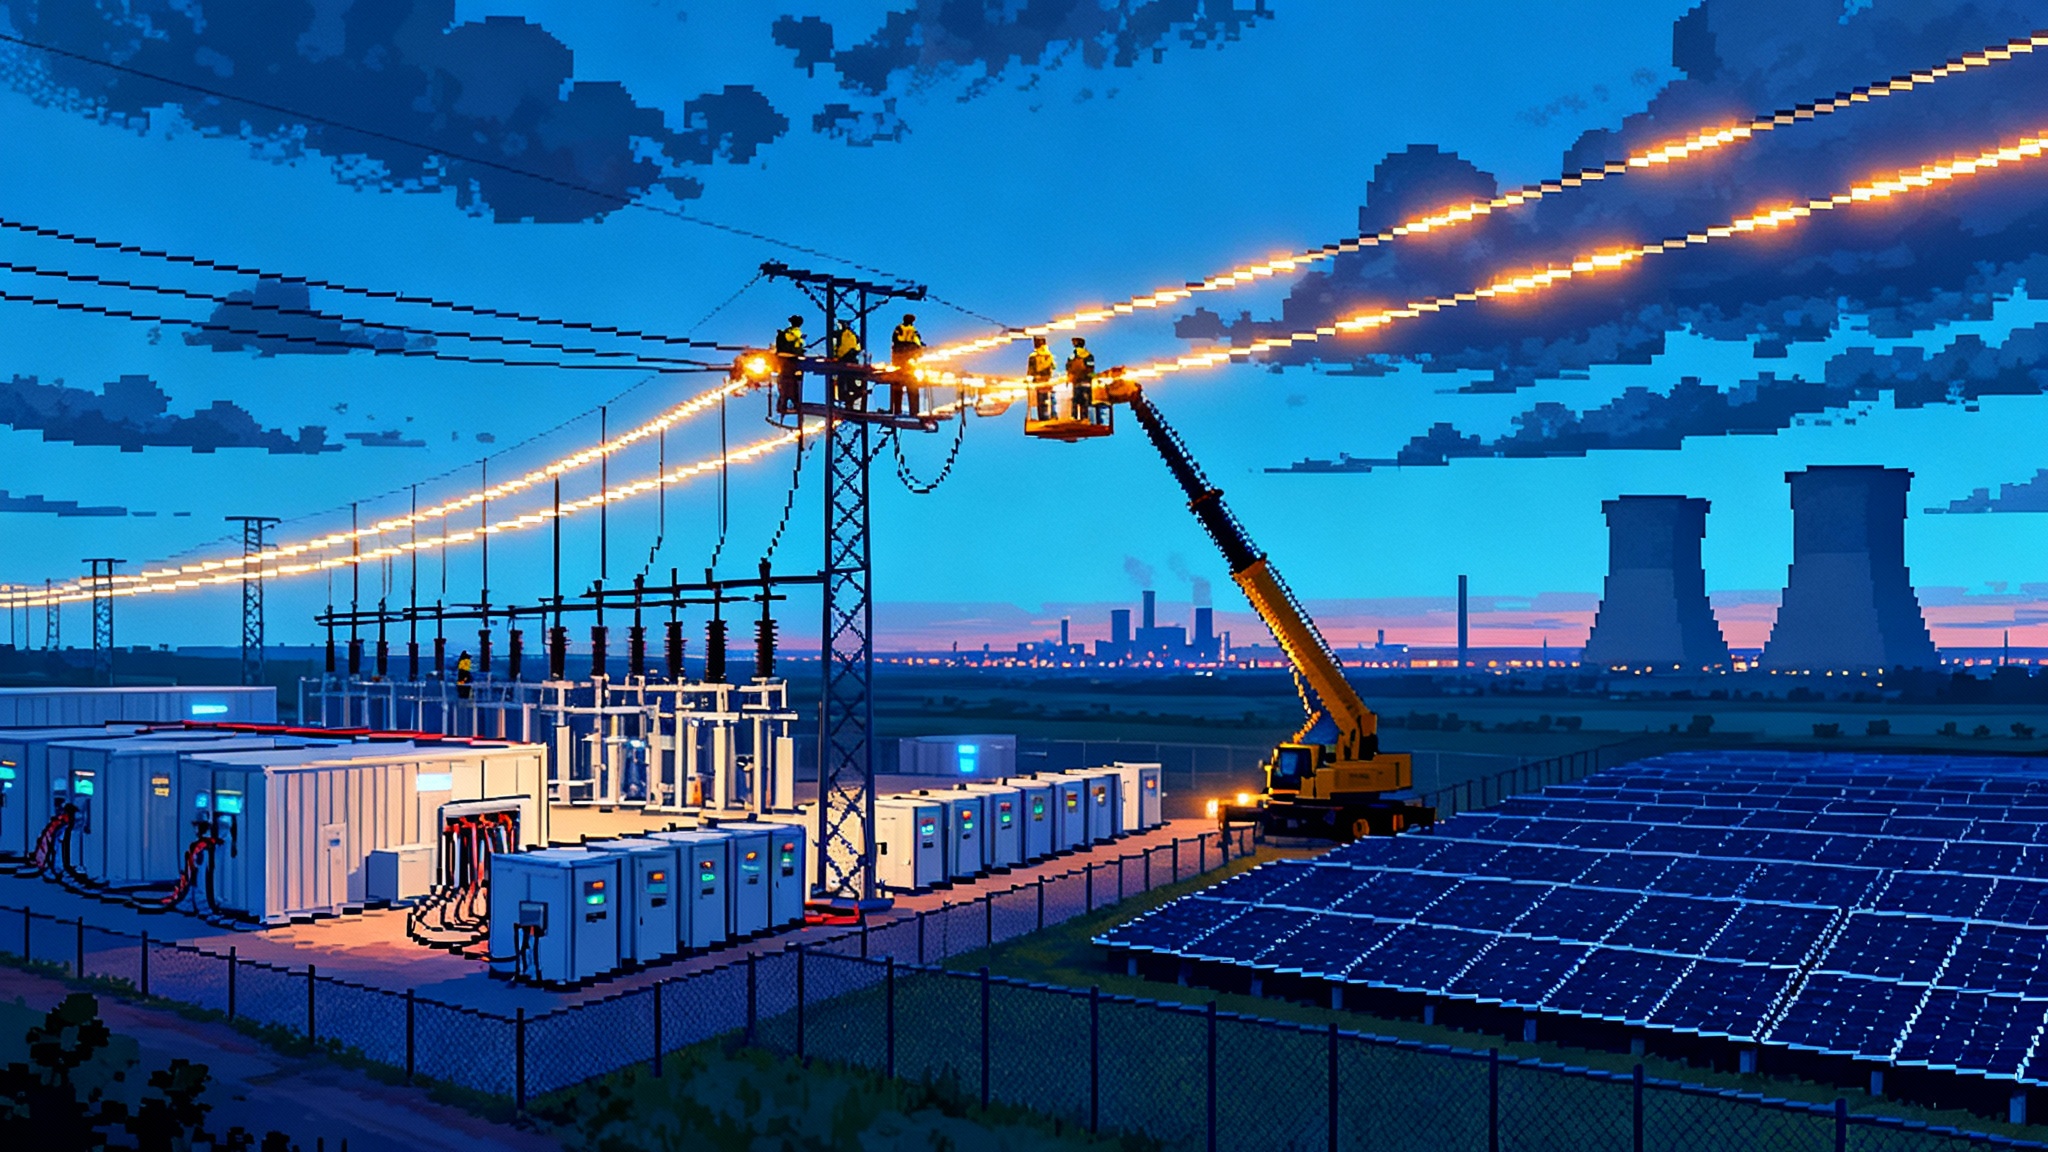
Co‑located power, not remote promises. If hourly matching will decide your credit in five years, the safe bet is to control as much of your power portfolio as you can. Buy or develop new solar and wind near the electrolyzer, add storage, and sign physical delivery contracts when possible.
-
Fewer mega‑hubs, more clusters. Big national hubs made for great maps. The next phase favors two to five project clusters in a region that share power and logistics and sell to the same buyers. Clusters capture scale where it matters, in procurement and interconnection, without creating a single point of failure.
-
Financeable simplicity. The winners will read like utilities, not moonshots. Clear engineering, transparent power supply, bankable offtake, and conservative schedules. If a project narrative needs five new technologies to work at once, it will not make this cut.
A practical conclusion
The October cancellations were not the end of American hydrogen. They were the end of a phase. The market is rewriting the script around 45V, time‑matched clean power, and buyers that will commit in ink. If you are a developer, pick sites where you can control power and reach a real customer. If you are a buyer, ask for a delivered price backed by a power plan that still clears when the clock strikes 2030. If you are an investor, reward teams that show discipline on offtake, that build storage into the plan, and that value a clean audit file as highly as a substation.


