XRISM’s Resolve Turns X-ray Light Into a Cosmic Weather Map
{"excerpt":"XRISM has opened its first vault of Performance Verification data, and Resolve’s microcalorimeter is translating X-ray spectra into maps of motion, temperature, and turbulence. Here is what the release unlocks and what to watch as the Kyoto meeting begins."}

Breaking: XRISM opens its vaults, and the sky suddenly has weather
On September 10, 2025, the teams behind the X-ray Imaging and Spectroscopy Mission made the first large public release of Performance Verification data, a six month trove that shows what the satellite can really do. The release marks XRISM’s transition into regular General Observer science and places premium, calibration-quality data in the hands of anyone ready to download and analyze it. The project’s managers describe this as the bridge between demonstration and discovery, and the bridge is now open to traffic. Explore the XRISM Performance Verification data release.
The new data set is already reshaping questions about exploding stars, black hole outflows, and the physics of extreme disks. The reason is simple and profound: XRISM’s Resolve spectrometer turns X-ray light into motion, temperature, and turbulence, element by element, in a way no current observatory can match.
From color to weather: how a microcalorimeter reads motion
Resolve is a microcalorimeter. Instead of spreading light into a rainbow like a prism, it measures the tiny heat pulse that each incoming X-ray deposits in a pixel cooled to a few hundredths of a degree above absolute zero. At around 6 kiloelectronvolts, Resolve separates X-rays that differ by about five electronvolts. Another way to say it: it can hear a whisper of change in the pitch of an iron atom’s X-ray note.
That whisper carries information. If an iron atom is moving toward us, its X-ray line is shifted to slightly higher energy by the Doppler effect. If it is moving away, the line shifts lower. If the gas is churning, the line broadens. If the ions themselves are hot, their thermal motion broadens the line in a different way. And because each element radiates at its own set of energies, XRISM can read all of this element by element, layer by layer.
Think of a stadium crowd singing in sections. With a conventional X-ray camera, you hear a loud roar. With a microcalorimeter like Resolve, you can pick out the altos in section 102, the tenors in 103, and tell who is singing ahead of the beat, who is dragging, and where the chorus is going slightly flat. It is not just a picture, it is a performance log.
A detail worth noting for instrument watchers: Resolve’s gate valve remains closed, which reduces sensitivity below about 2 kiloelectronvolts. Even so, the instrument’s energy resolution has met and, in key bands, exceeded its prelaunch goals. The result is exquisite fidelity around the iron K lines near 6 to 7 kiloelectronvolts, where much of the high-energy weather is written.
First fruits of 2025: supernova ejecta, black hole winds, neutron star disks
XRISM’s early science papers this year draw a clear arc across three frontier regimes.
-
Supernova ejecta mapped by element. In dense, knotty remnants like W49B, Resolve tracked the line-of-sight velocities of iron, chromium, manganese, silicon, sulfur, argon, and calcium. The measurements reveal a smooth east-to-west velocity gradient of a few hundred kilometers per second, with different elements tracing the same overall flow. That pattern rules out a simple equatorial disk of ejecta and instead points to bipolar flows or channeling by a pre-existing cavity. The mechanism matters: it fingerprints how the original star died and how the blast sculpted its environment. In the Large Magellanic Cloud’s bright remnant N132D, XRISM also picked out faint features from highly excited silicon that arise when hot ions steal electrons from neutral atoms, a process called charge exchange. That tells us where shock fronts are actively plowing into denser clouds, and how energy is being shared between hot and cold phases.
-
Bullet-like winds from a supermassive black hole. Using Resolve to examine the quasar PDS 456, XRISM found that what used to look like a single, smooth outflow is in fact a stack of components moving at different fractions of light speed, some approaching a third of that limit. The lines resolve into multiple, distinct absorption systems, like a speed trap that catches not one car but a caravan going at different velocities. The analysis shows these winds carry more energy than expected and are clumpy rather than continuous, a key twist in how galaxies feed back energy into their halos. JAXA summarized the results in May in a public release on the mission site; see the overview on the XRISM science page.
-
The innermost accretion disks around neutron stars. Resolve’s sharp view of the iron emission line in Serpens X-1 reveals the double-horned, skewed profile expected from gas whipping around a compact object in a strong gravitational field. Modeling that line locates the inner edge of the disk essentially at the innermost stable circular orbit, the last safe ring before matter spirals inward. That anchors decades of less precise measurements with a clean, physics-forward result, and it moves neutron star accretion into a regime where line shape changes can be watched over hours to days as the geometry and radiation field evolve.
What unites these results is not just spectral resolution for its own sake. It is the ability to separate bulk flows from turbulence, and turbulence from ion temperatures, and to do so for individual elements that trace different layers of a system. That is the new lever arm for discovery.
Why this is a leap: from static pictures to dynamic diagnostics
Before Resolve, high-energy astrophysics often had to infer motion indirectly. You could model a broad iron line and claim it was blurred by rapid orbits near a black hole, but you did not have the spectral grating to read the small scale structure that proves the point. You could measure the average temperature of cluster gas, but you had little grip on how much of the pressure was tied up in random motions. You could map a supernova’s brightness, but not its element-by-element kinematics across the field.
Resolve changes the terms of the conversation by compressing three separate diagnostics into every spectrum:
- Bulk velocities from line centroids. Shifts of a few electronvolts correspond to hundreds of kilometers per second. With careful calibration, these become clean kinematic maps.
- Turbulent velocities from line widths. If a line is broader than what the instrument produces from a single sharp input, the excess is turmoil in the gas. That width untangles into a velocity dispersion, which can be translated into a fraction of the pressure budget.
- Ion temperatures from thermal broadening. Heavier ions like iron barely broaden thermally, while lighter ions like silicon do so more. Comparing elements yields separate temperatures for ions and electrons, a clue to where shocks are fresh or plasma is out of equilibrium.
In the core of the Centaurus cluster, for example, Resolve found gas sliding toward us by roughly a few hundred kilometers per second, the pattern expected from sloshing set off by past minor mergers. In relaxed clusters like Abell 2029, Resolve measured a modest velocity dispersion of about 170 kilometers per second, implying that only a few percent of the pressure is non-thermal. In a dynamically disturbed system such as Abell 2319, pockets of enhanced dispersion around 400 kilometers per second mark where sloshing and small scale stirring are converting kinetic energy into heat. These are not model-dependent inferences. They are direct readings of how the gas is actually moving.
For supernova remnants, the payoff is not a single number but a map across elements. Iron group lines follow one gradient, intermediate mass elements the same gradient, and each can be compared against shock tracers at other wavelengths. That makes it possible to tell whether the explosion truly ejected material in jets, or whether a shaped environment pushed the blast into a false symmetry. For black hole and neutron star disks, Resolve pushes line physics into the regime of time. Watch the same system across days, and you can see winds turn on and off, disk edges creep inward or outward, and the balances between radiation pressure, magnetic stress, and gas pressure shift in real time.
What to watch this week in Kyoto
From October 20 to 24, 2025, the first XRISM international conference convenes in Kyoto. Expect a flood of talks that turn the PV release into a new baseline. Based on what we have seen so far, here are the likely categories where the needle will move most.
- Cluster weather maps with contours of turbulence. Look for velocity and dispersion mosaics across cold fronts and merger interfaces. Perseus and Coma are the famous cases, but the surprise may come from intermediate mass systems where feedback and sloshing are both active. If non-thermal pressure fractions routinely sit below about 10 percent in relaxed cores, mass estimates for clusters used in cosmology will tighten.
- Rapid response to transients. Resolve’s strength is precision, yet it can still catch fast changes if the observatory is pointed in time. Tidal disruption events, magnetar bursts, and stellar mass black hole outbursts will test how quickly winds appear, how clumpy they are, and whether they saturate at lower speeds in neutron star systems than around black holes.
- Element-by-element Doppler tomography in supernova remnants. Expect multiple remnants beyond W49B and N132D to get the full treatment. If several show smooth gradients instead of twin peaks in their line profiles, the community will revise how often core collapse supernovae launch true jets, and how often we are misled by cavities carved by stellar winds.
- Disk physics that toggles in hours. With the Serpens X-1 result now in hand, teams will push for higher cadence and multi-epoch campaigns to track the iron line shape as a function of luminosity. That turns a static diagnostic into a stopwatch on accretion geometry.
- Calibration updates and pipelines that scale. The PV release arrives alongside calibration database updates that sharpen line energies and widths. Expect sessions devoted to best practices for systematic errors at the electronvolt level and to shared code that turns Resolve’s raw counts into weather maps reproducibly.
How this accelerates the path to Athena-class X-ray astronomy
The European Space Agency’s next large X-ray mission, often labeled Athena-class in community shorthand, will rely on microcalorimeters with many more pixels to survey larger areas at the resolution Resolve is demonstrating. XRISM is the proof of concept in orbit, under real backgrounds, on real targets, with absolute calibrations pushed to sub-electronvolt accuracy. It is where the methods are hardened.
Three concrete ways this shortens the road:
- Measurement recipes. The techniques for separating bulk flow, turbulence, and ion temperature will transfer nearly verbatim to larger arrays. XRISM provides the test cases that define exposure times and signal-to-noise thresholds for future surveys.
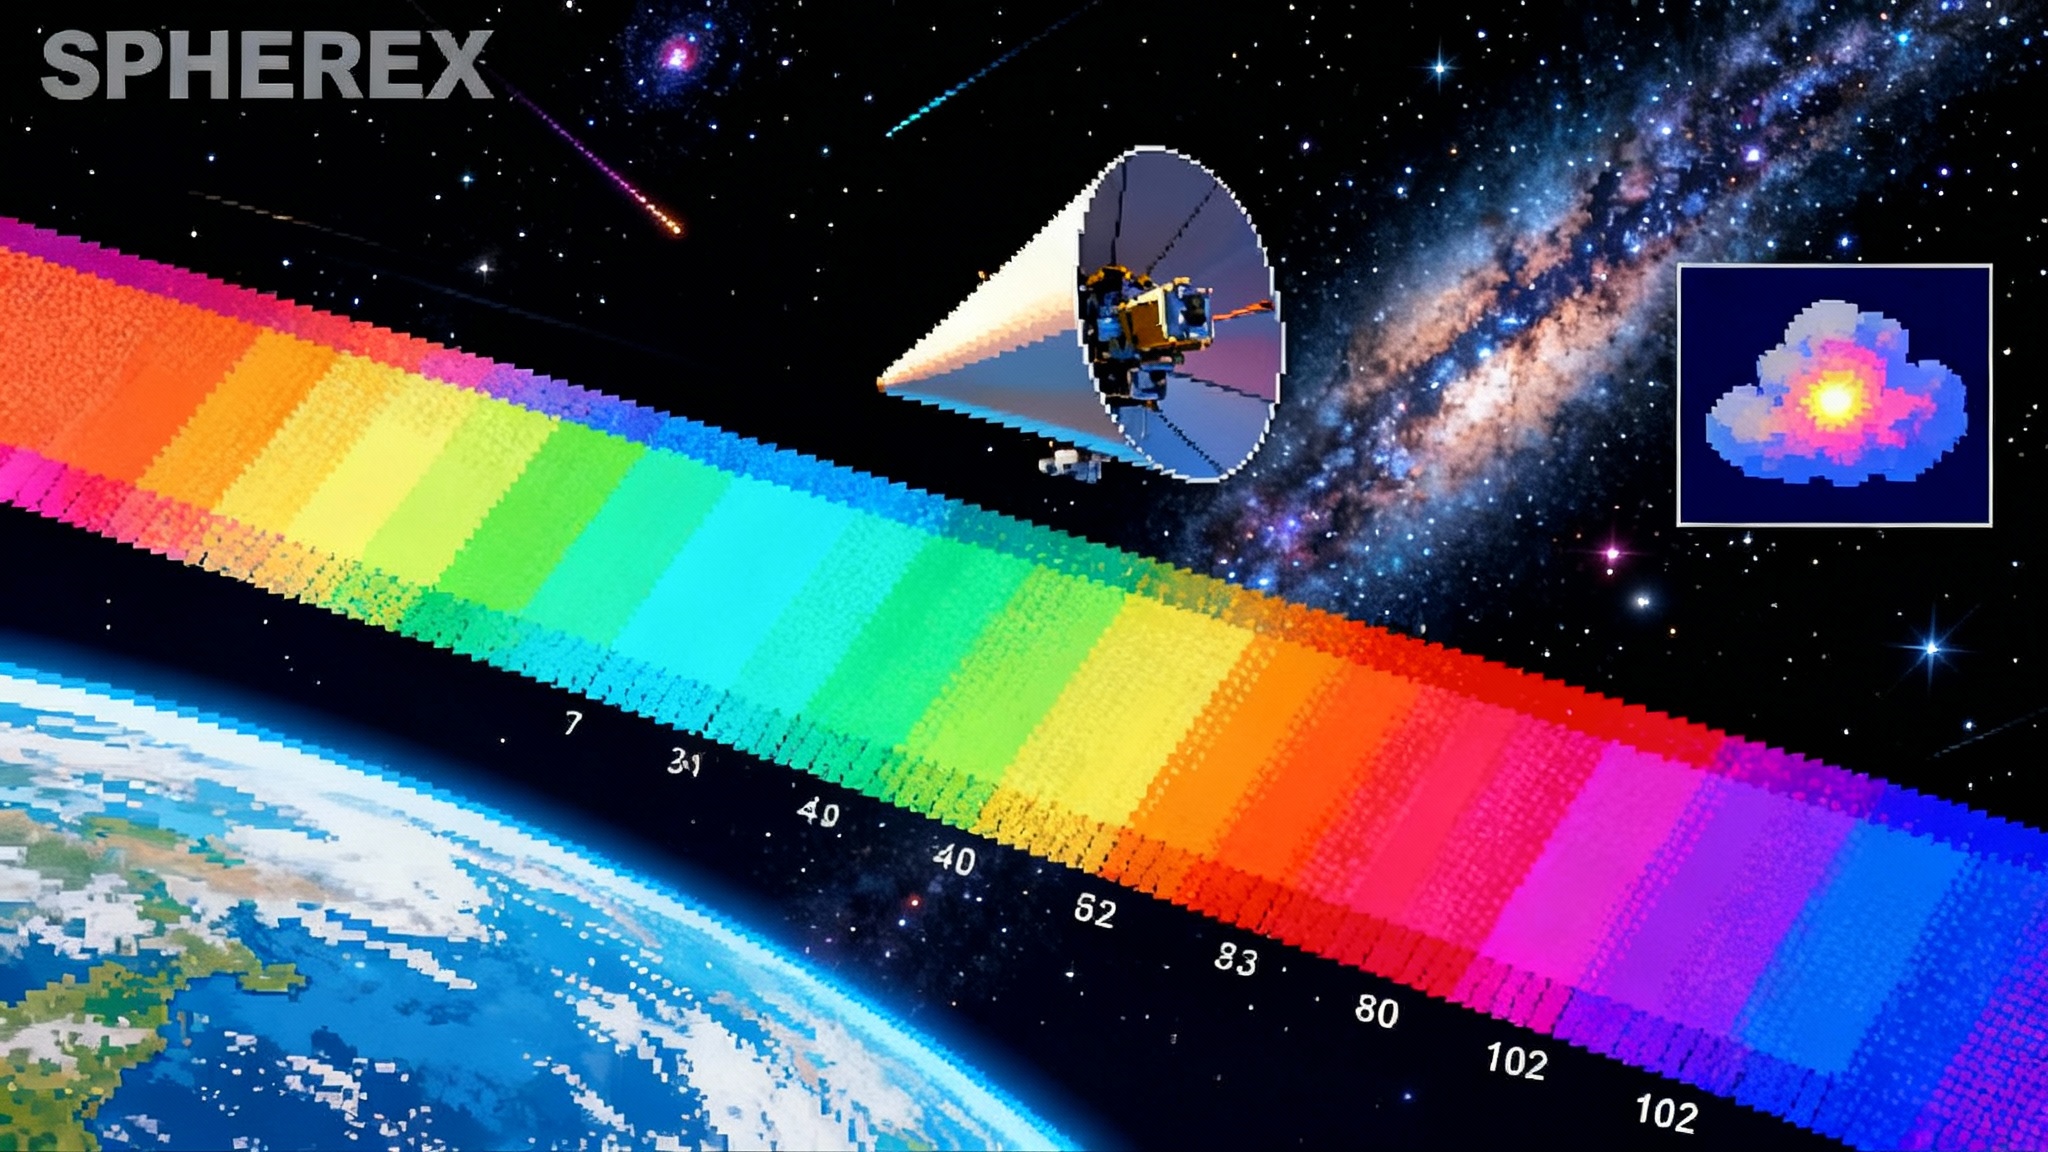
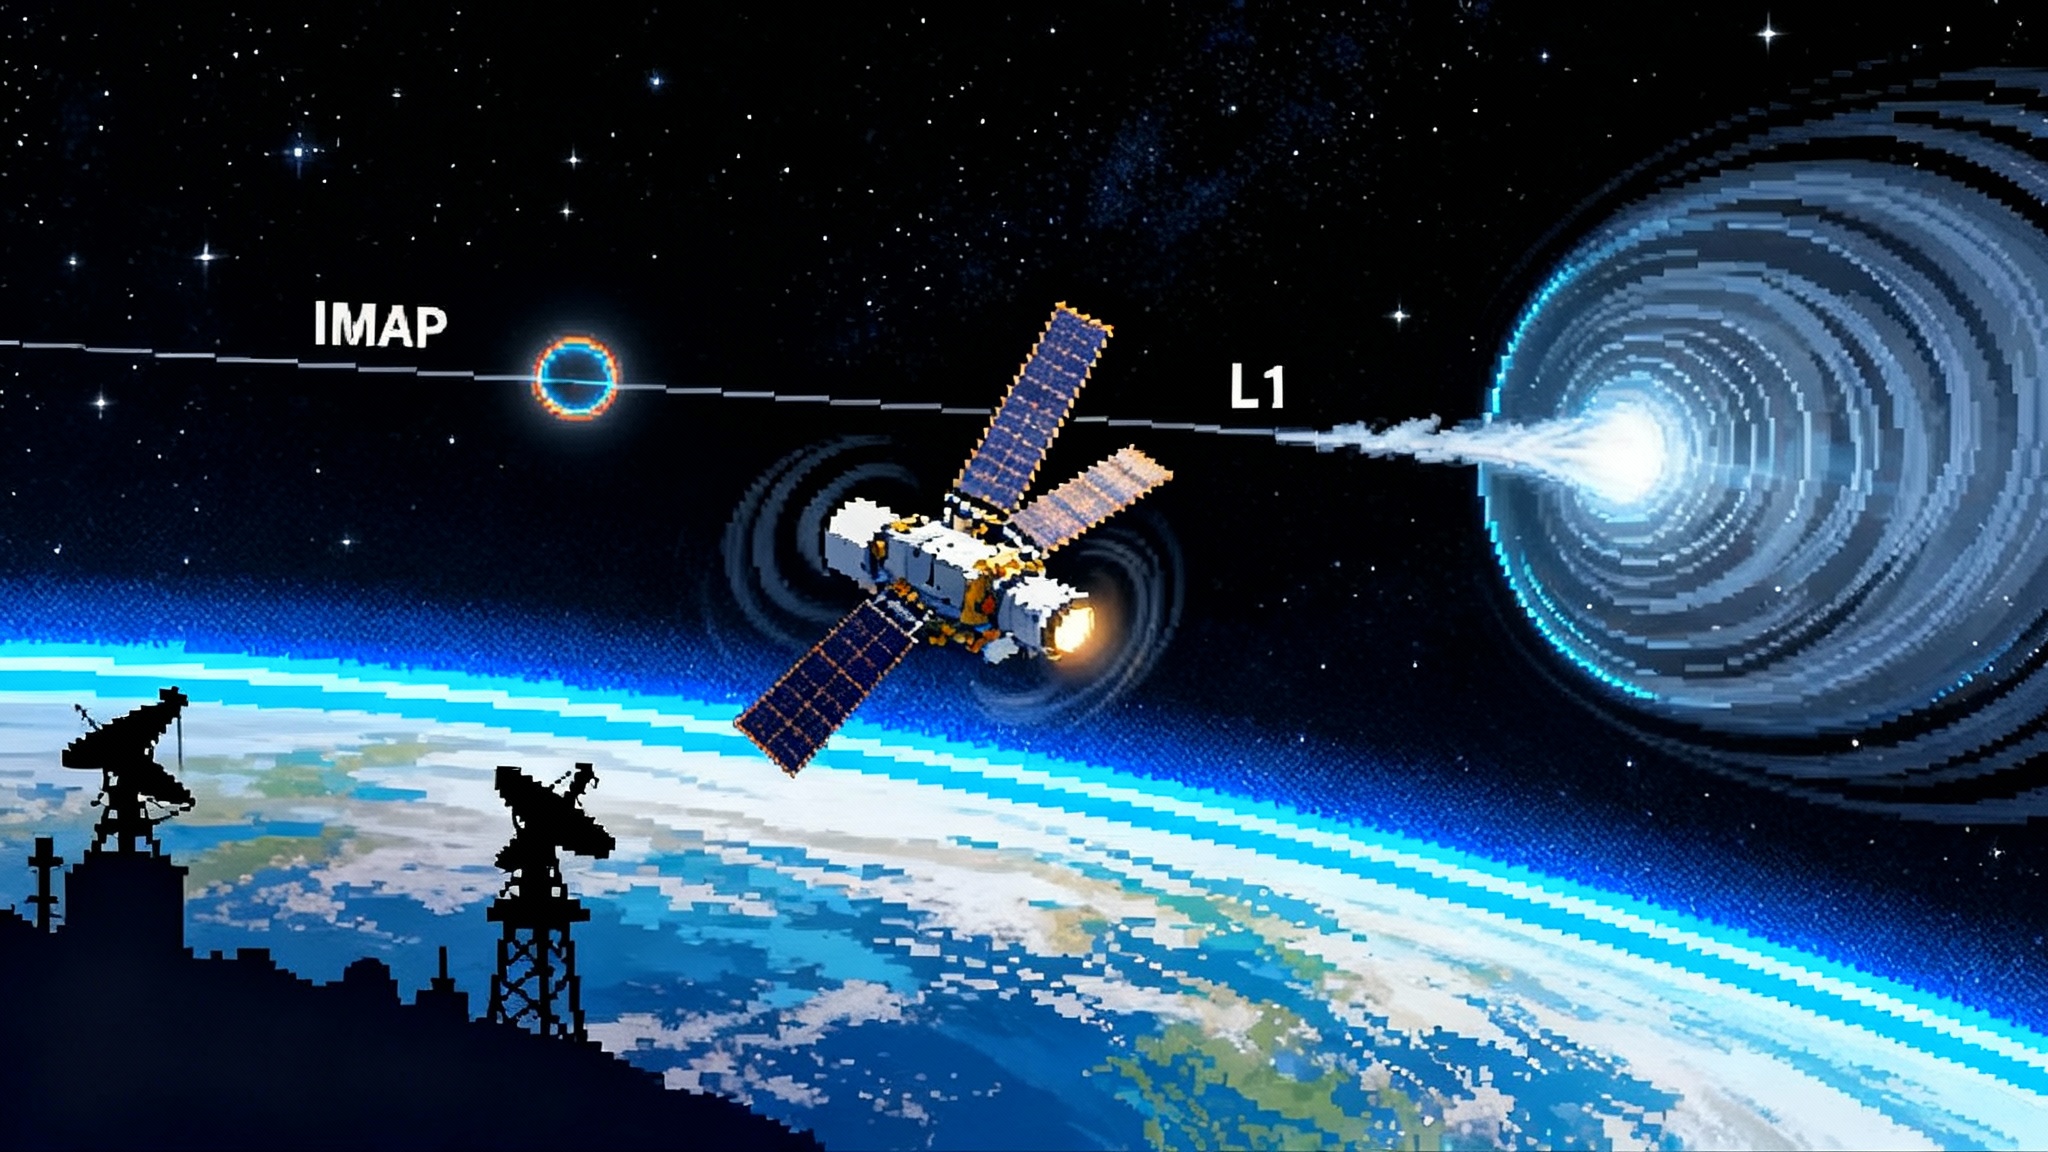
- Multi-observatory choreography. XRISM’s strongest results often line up perfectly with what other facilities need. For example, the Interstellar Mapping and Acceleration Probe complements XRISM’s kinematics; see our take on the IMAP heliosphere weather map. The Vera C. Rubin Observatory will drive time-domain targets; preview that cadence in Rubin’s 2026 discovery wave. And wide-field spectroscopy will set the larger context; compare with the SPHEREx 102-color sky map.
- Hardware confidence. Resolve’s stability at a few electronvolts near 6 kiloelectronvolts, achieved on orbit with a closed gate valve and a cryogenic chain that holds to tens of millikelvin, retires risk for the next generation. Cold pixels, multiplexed readouts, in-flight calibration sources, and long duration background monitoring are no longer laboratory promises. They are flight-proven systems.
A practical guide for readers who want to dive in now
- Start with iron. For compact objects and clusters alike, the iron K complex around 6 to 7 kiloelectronvolts is the most information-dense region of the spectrum. If you are new to high-resolution X-ray spectroscopy, build intuition by fitting just this band and letting the line tell you its story: centroid, width, skew.
- Map before you model. For extended sources, use Resolve’s pixel grid as a coarse spectrograph. Derive centroids and widths in each pixel and make velocity and dispersion maps first. Only then layer on plasma codes and detailed emission models. You will see the sloshing edges and turbulent pockets immediately.
- Treat winds as multi-component by default. The PDS 456 result is the cautionary tale. Single-component fits will miss clumps and undercount the energy budget. Start with several velocity components and let the data tell you what to prune.
- Plan multi-epoch campaigns. The most revealing Resolve results so far are those that watch systems change. Even one repeat visit can break degeneracies between geometry and ionization state.
The forecast
The Performance Verification release is less a museum opening and more a utility hook-up. It routes the live signal of cosmic weather into the broader community, where ideas and tools compound quickly. This week in Kyoto, expect fresh maps of sloshing cores, sharper looks at winds that come in bullets rather than breezes, and disks whose edges mark the boundary where gravity wins. Then, as General Observer programs ramp and rapid-response triggers fire, the maps will go from snapshots to cinema.
Resolve has shown that X-ray light is not just bright or faint, hot or cold. It carries the motions, the eddies, and the temperatures of specific elements across specific places. That change in what we can read is the change in what we can ask. And that is how you accelerate a field: by turning the sky into a weather report you can finally trust.
