SPHEREx Goes Live: A 102-color Atlas of the Entire Sky
Launched in March 2025, NASA’s SPHEREx has taken first-light images and begun a two-year, 102-color all-sky infrared survey. Over the next year it will map water and organics, sharpen inflation-era cosmology, and supercharge rapid follow-ups with JWST, Euclid, and Rubin.
Breaking first light and the universe in 102 colors
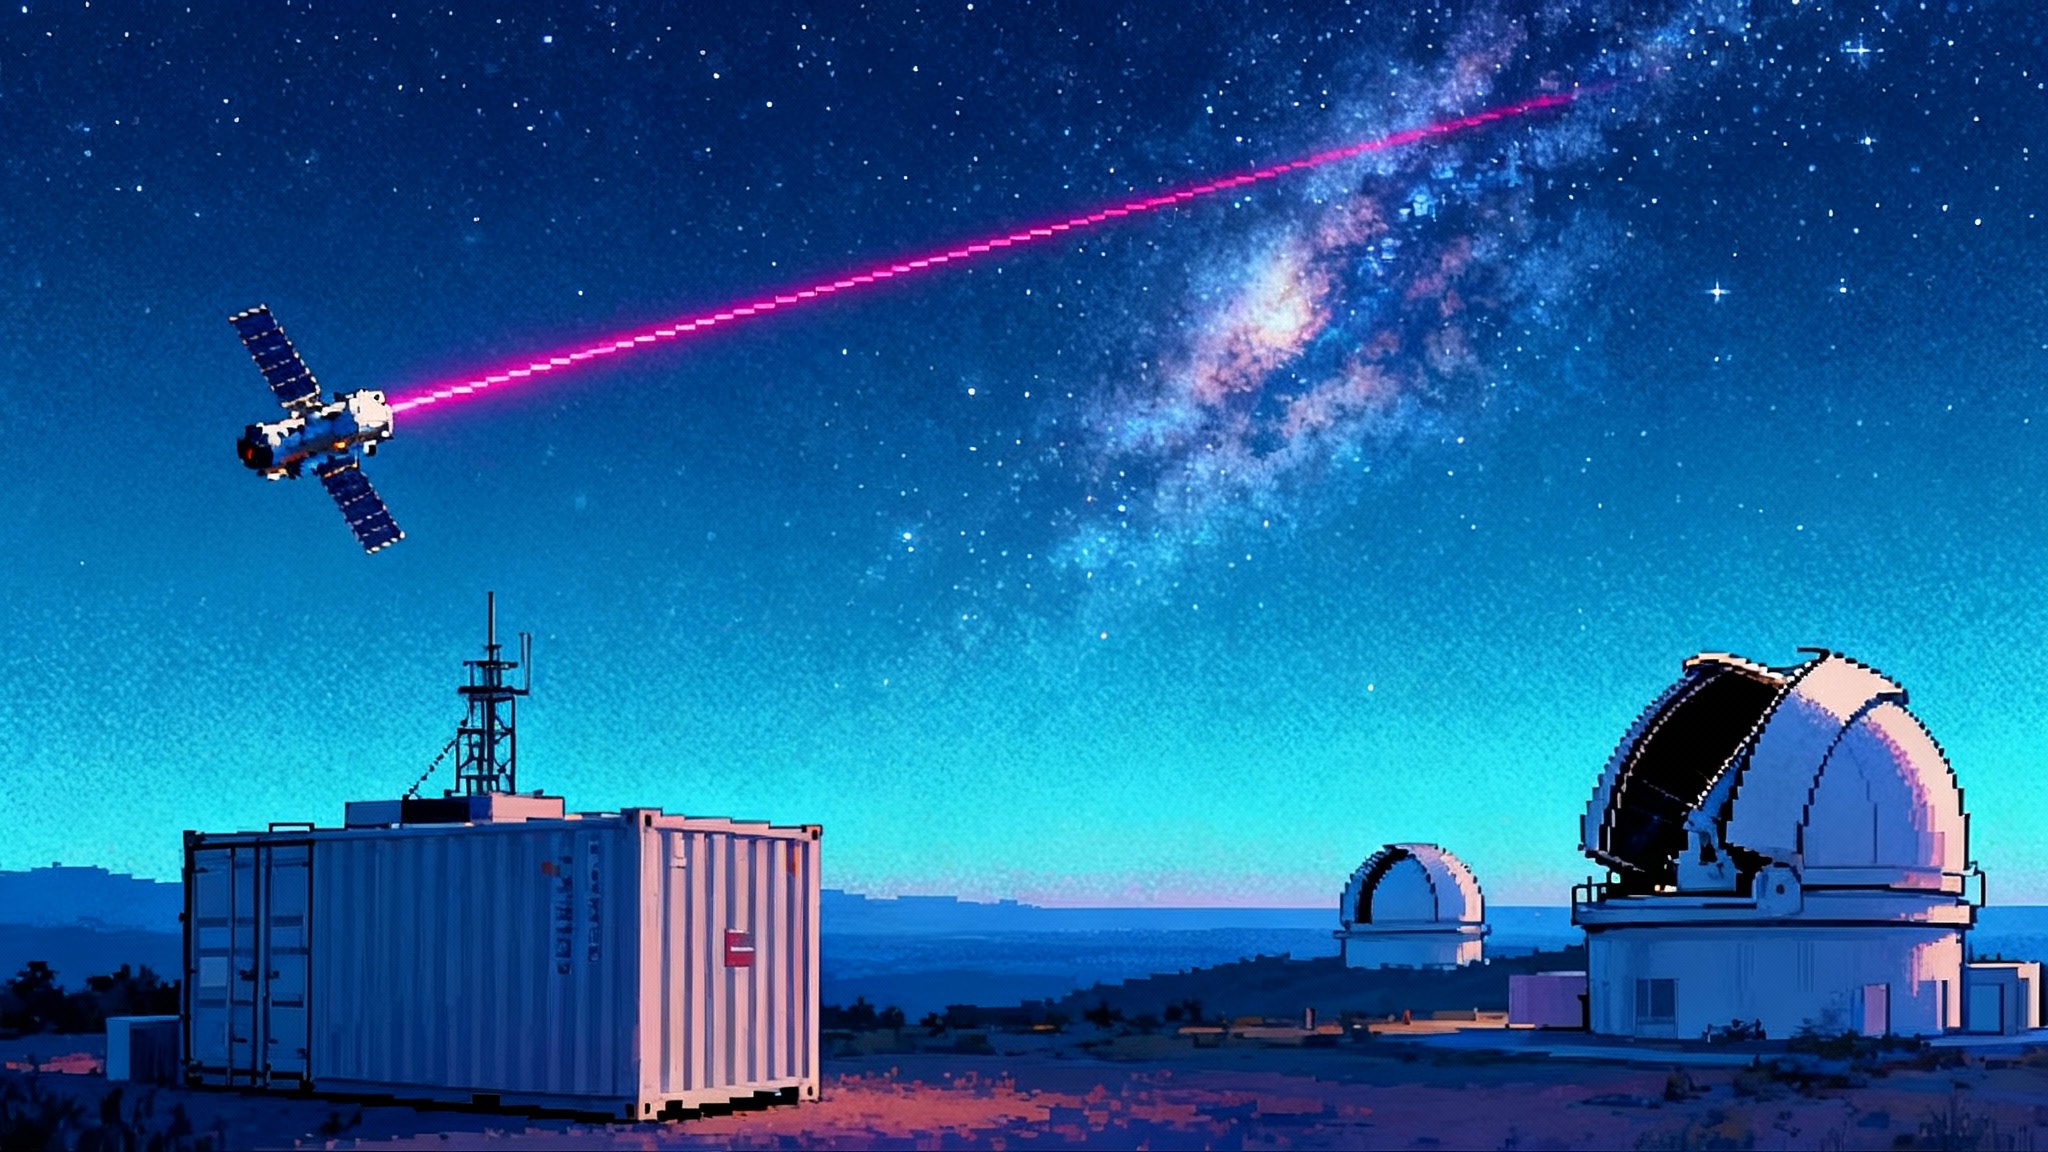
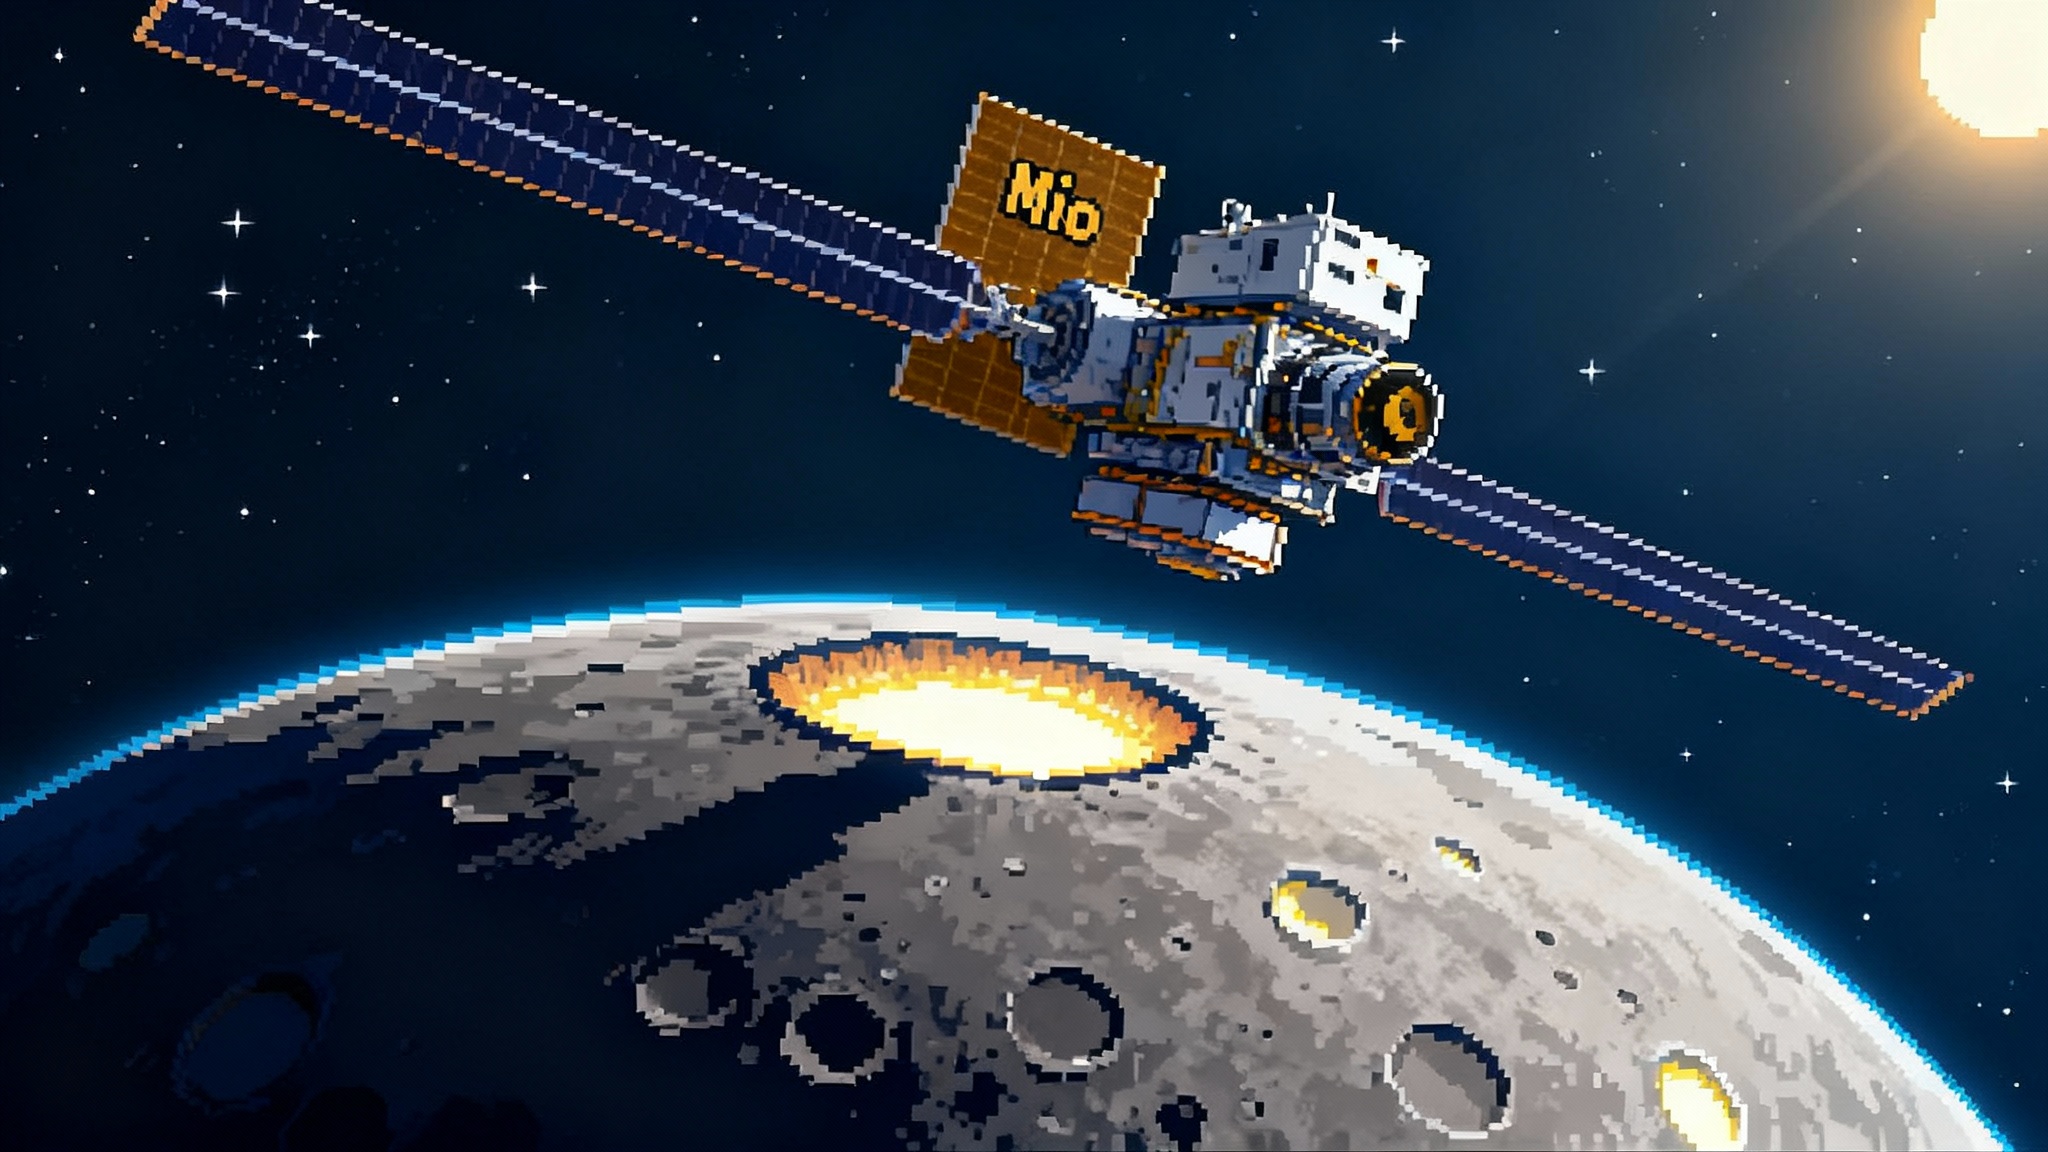
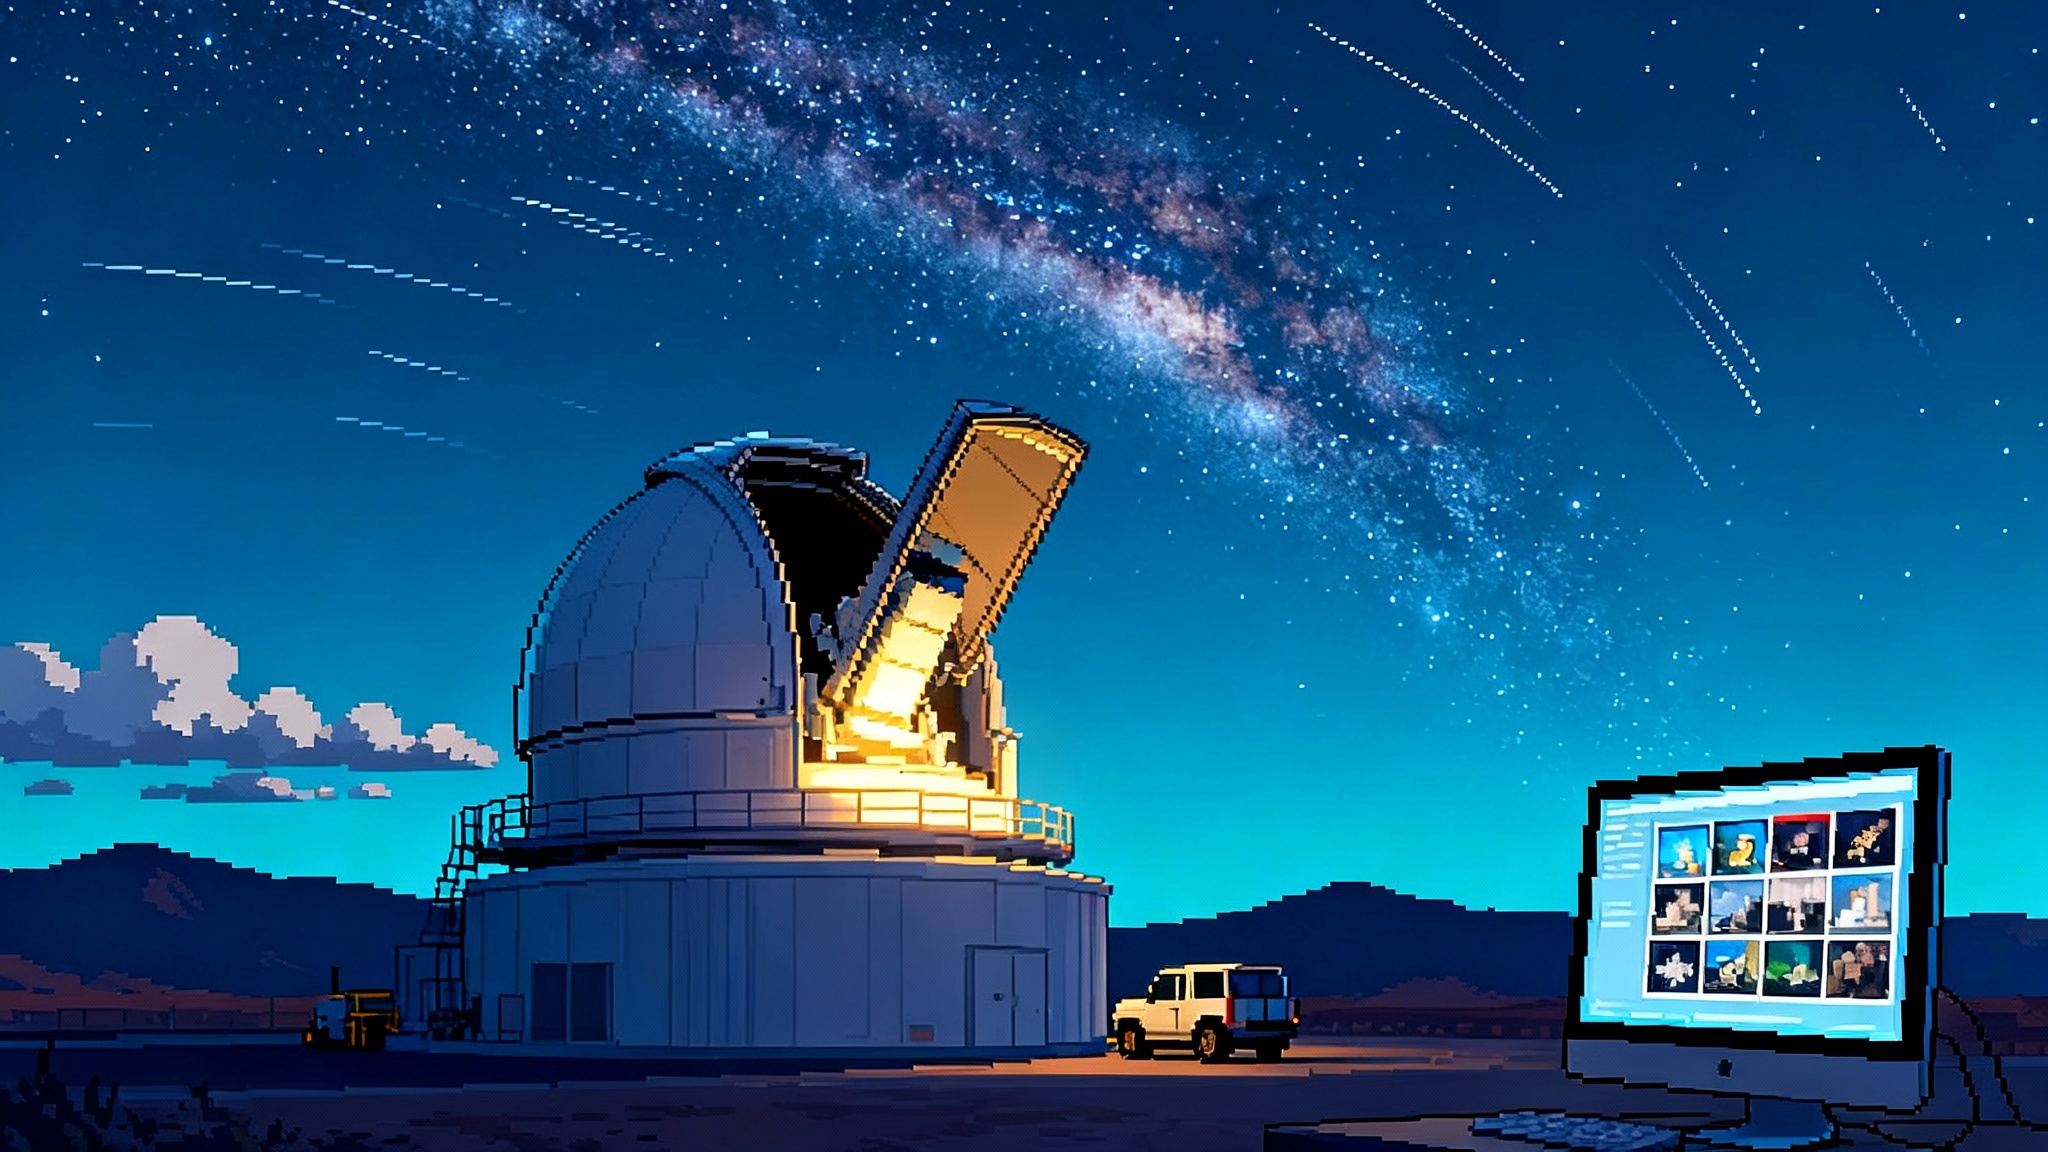
At 7:09 p.m. Pacific Time on March 11, 2025, a SpaceX Falcon 9 rose from Vandenberg Space Force Base with NASA’s SPHEREx observatory on board. Sixteen days later, SPHEREx captured its first images in space, a six-panel exposure revealing more than one hundred thousand light sources in a single field. NASA confirmed the early images on April 1 and noted that the observatory was working as designed, with routine science operations following shortly after. You can see those early results in NASA’s release, SPHEREx takes first images, preps for science.
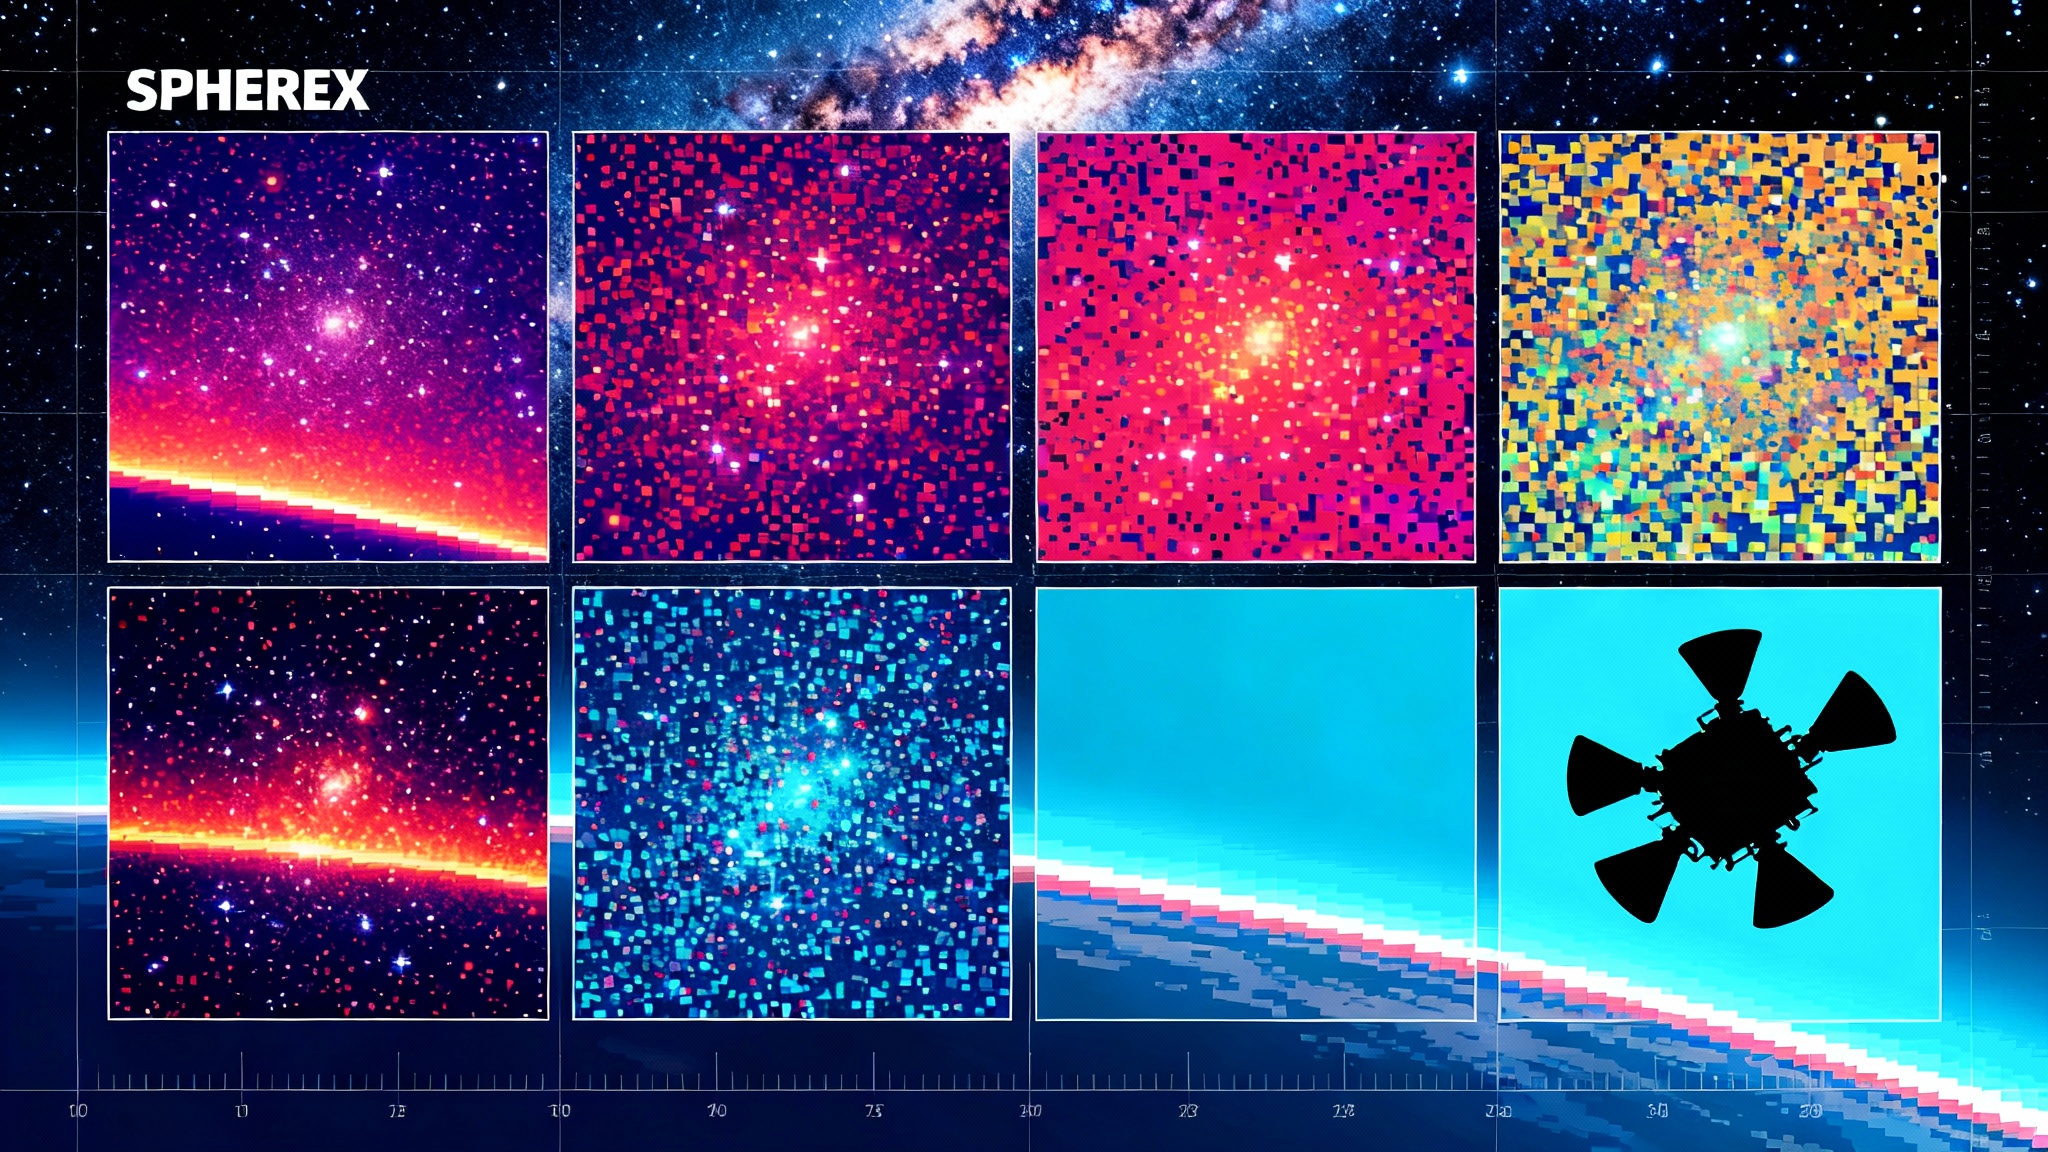
SPHEREx stands for Spectro-Photometer for the History of the Universe, Epoch of Reionization and Ices Explorer. Instead of taking a few deep, narrow pictures like the James Webb Space Telescope (as showcased in JWST’s 3D exoplanet map), SPHEREx takes wide, shallow pictures everywhere and does so in many narrow color slices. Six fixed detectors look through filters whose passbands vary across the field, so each exposure records a low-resolution spectrum for every point on the sky. One exposure yields six images; the mission takes about six hundred exposures a day, which adds up to roughly 3,600 images daily. Over six months the spacecraft sweeps the entire celestial sphere, then does it again.
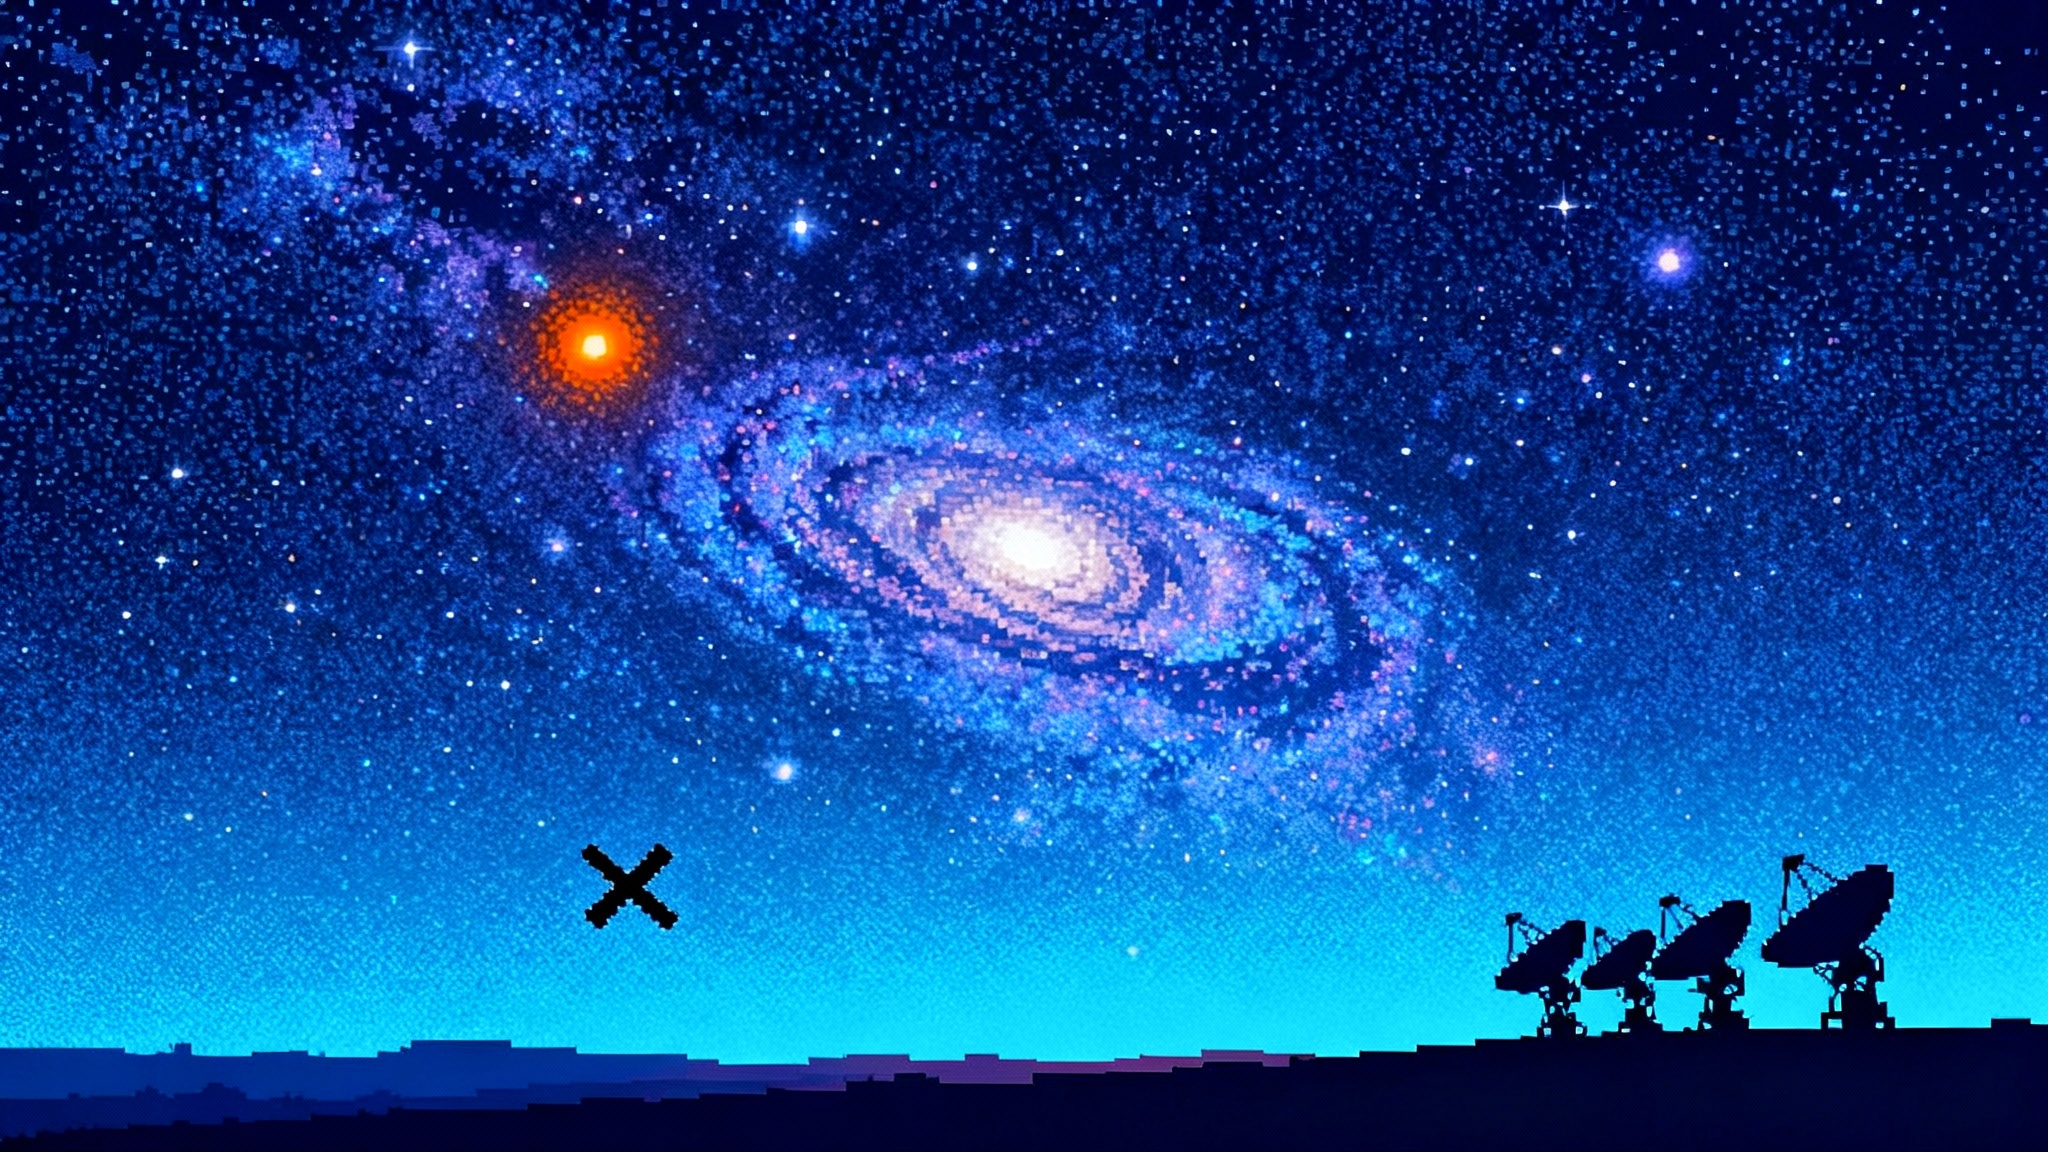
Think of it as a global weather satellite for the cosmos. SPHEREx watches dust, gas, and galaxies drift across the sky in the near infrared, from about 0.75 to 5 micrometers, with 102 distinct colors. The result is not a single pretty picture, but a living atlas that keeps improving with each pass.
What the next year unlocks
1) A census of interstellar water and organics
SPHEREx is tuned to the chemical fingerprints that ice and simple molecules leave in infrared light. The 3.05 micrometer dip from water ice is prominent in cold, dusty clouds where stars and planets begin. Carbon dioxide has a strong feature near 4.27 micrometers. Methanol and carbon monoxide leave signatures too. Because SPHEREx scans the whole sky, it can collect millions of core samples along different lines of sight through molecular clouds and protoplanetary disks. Rather than a few case studies, astronomers will get a census: where water and organics are common, where they are scarce, how they cluster around infant stars, and how radiation or shocks change the chemistry from place to place.
This is the difference between tasting one stream to judge a watershed and running a network of sensors across all rivers and aquifers. In practical terms, the SPHEREx atlas will show where to point higher-resolution spectrographs. If a star-forming region in the Perseus cloud lights up strongly at the water-ice band, the team behind a large ground telescope can request time for a closer look. If a dark lane in the Large Magellanic Cloud shows the 3.3 micrometer glow from polycyclic aromatic hydrocarbons, a group studying carbon chemistry can line up follow-ups immediately. Over the next year, as SPHEREx completes two full-sky passes, those ranked lists of high-interest targets will be updated again and again.
2) Inflation-era cosmology at galactic scales
Cosmic inflation is the name given to a burst of accelerated expansion in the first instants of the universe. It left faint statistical traces in the large-scale web of galaxies that we see today. The way to test those traces is to map an enormous volume of space and measure how galaxy clustering changes with scale and redshift. SPHEREx is well suited for this because it will estimate redshifts for hundreds of millions of galaxies by fitting their low-resolution spectra, especially using a common bump in galaxy spectra around 1.6 micrometers in the rest frame.
What does that buy us in the next twelve months? First, the mission will produce early catalogs of galaxy positions and redshifts across nearly the entire sky. These catalogs can be cross-checked with narrower but deeper surveys to calibrate biases. Second, the combination of SPHEREx’s broad map with shear measurements from weak-lensing surveys allows tests of whether primordial fluctuations were perfectly Gaussian or not. If the statistics deviate even slightly from a Gaussian distribution, that points toward multi-field inflation models rather than the simplest single-field picture. SPHEREx was designed to reach the level where these differences become distinguishable in concert with other surveys.
3) A rapid-response feeder for JWST, Euclid, and Rubin
The James Webb Space Telescope can zoom in for exquisite details, but it cannot scan the entire sky at speed. Euclid, led by the European Space Agency, is mapping weak gravitational lensing and galaxy clustering in optical and near infrared. The Vera C. Rubin Observatory in Chile is taking repeated optical images of the southern sky, flagging transients and changing objects in near real time. SPHEREx slots into this ecosystem as the wide-field scout. It tags the chemistry and low-resolution spectra of sources that JWST can later dissect in detail. It supplies color information that shores up redshift estimates for Euclid and Rubin galaxies, reducing catastrophic outliers that can skew cosmology. And for time-sensitive events, SPHEREx adds a quick spectral fingerprint that helps decide which targets deserve precious minutes on telescopes that must be scheduled and slewed. For context on the coming alert deluge, see Rubin’s year of fast discovery.
One example: Rubin will soon trigger on millions of transients, from ordinary supernovas to rare tidal disruption events. With an always-updating spectral atlas, astronomers can cross-match a new burst against the nearest SPHEREx spectra to infer local dust content, host-galaxy type, or the presence of strong emission features. That context can swing a decision within hours, moving a candidate up or down the queue for JWST or a giant ground telescope. The same logic applies to comets, near-Earth asteroids, and interstellar visitors. If SPHEREx sees carbon dioxide or water-rich signatures in a moving object’s trail, teams can pounce while it is still bright. Recent surprises such as a day-long gamma-ray burst underscore the value of rapid context, as covered in Einstein Probe’s day-long GRB.
From first light to always on
What makes this shift possible is not only the scan strategy, but the data policy. The mission is regularly delivering data to a public archive, with a full 102-color sky release targeted at the one-year mark. That cadence matters. It turns SPHEREx from an occasional mapmaker into an operational layer in astronomy’s discovery stack, like a base map that keeps refreshing and can be called by any pipeline that needs it. NASA has outlined how these deliveries will work and why they are designed to be accessible to both professionals and the public in how SPHEREx will share its all-sky map.
In practical terms, here is what the always-on atlas enables in the next year:
- Faster triage. Alerts from Rubin brokers can be filtered with SPHEREx spectral context. A supernova behind a heavy dust column is flagged differently from a clean line of sight.
- Better target lists. JWST programs that need water-rich disks or carbon dioxide rich clouds can pull the latest SPHEREx picks every few weeks. Euclid teams can cross-check photometric redshifts in difficult color ranges with SPHEREx’s near-infrared slices.
- Confidence checks. If two independent surveys disagree about a population, SPHEREx’s broad view can arbitrate. Did a deep field find an unexpected number of very red galaxies? Check if those colors persist at SPHEREx resolution across a wider area.
- Citizen science and education. Because the data are simple images and spectra, educators can build classroom labs around water-ice mapping or galaxy clustering without waiting years for proprietary periods to expire.
How SPHEREx works without moving parts
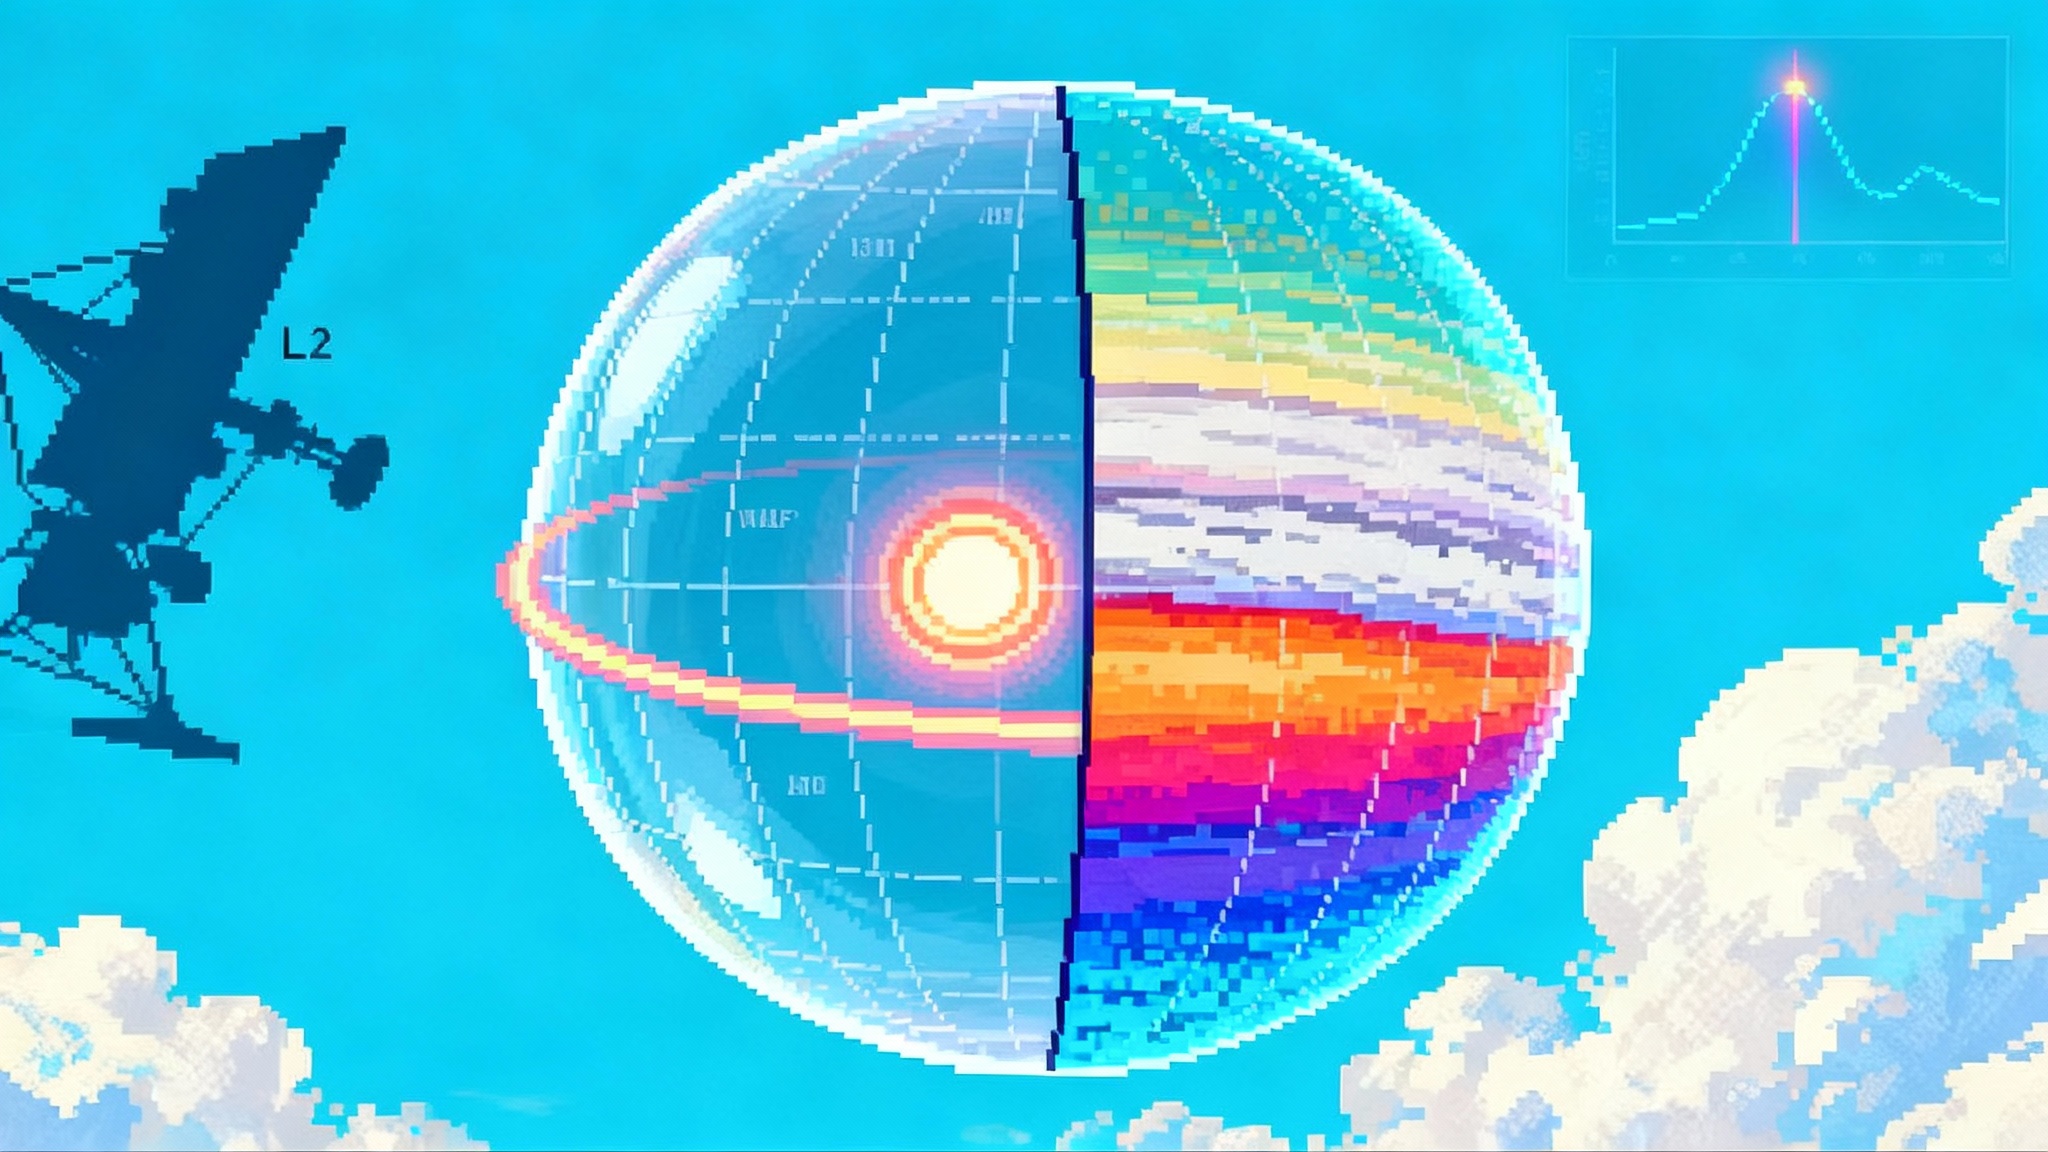
The hardware is intentionally simple. The telescope feeds six detectors that sit behind linear variable filters. Instead of rotating wheels or scanning gratings, the filters pass slightly different wavelengths at different positions on the detector. When the sky drifts across the field, each pixel samples a narrow wavelength band. Stitch together the positions and you get a low-resolution spectrum for every point.
This design has two wins. First, fewer moving parts means fewer failure modes over a two-year mission that must scan constantly. Second, the spacecraft does not have to perform tiny, precise motions within an exposure. It points, collects, shifts, and repeats. The three nested cones around the telescope and instrument radiate heat away to keep the detectors cold using passive cooling. BAE Systems, which acquired Ball Aerospace, built the spacecraft and instrument bus; Caltech and the Jet Propulsion Laboratory lead the payload and mission operations for NASA.
The field of view is wide, about 3.5 by 11.5 degrees, more than twenty times the diameter of the full Moon. Each exposure therefore nets a huge number of sources. The 102-color coverage lets SPHEREx pick out specific chemical and stellar features while keeping the exposures short enough to scan the whole sky twice a year.
What to watch between now and the first full-year map
- Two full-sky passes. By spring 2026, SPHEREx should have completed two complete scans, which greatly improves sensitivity when the data are combined.
- A first 102-color atlas at the one-year mark. Expect a public release that researchers can mine for thousands of projects simultaneously, from measuring the cosmic near-infrared background to mapping ices across the Milky Way.
- Chemistry at scale. Look for early papers that move beyond case studies to population maps: where water ice peaks near young star clusters, where carbon dioxide dominates, how those patterns correlate with local radiation fields.
- Inflation constraints. The first cross-correlation results will likely appear with cautious systematics tests, emphasizing a pattern across scales and redshift bins.
- Follow-up hits. Expect moments when SPHEREx flags a chemically unusual object that JWST or a giant ground-based telescope dissects in detail within days.
Concrete steps for teams ready to use the data
- Build cross-matching now. If you run a Rubin broker or a Euclid processing pipeline, add a SPHEREx module that ingests weekly updates. Cache per-source spectral indices near the water, carbon dioxide, and carbon monoxide bands so you can apply cuts on the fly.
- Pre-define triggers. Decide what spectral thresholds merit an automatic follow-up request. For example, a water-ice depth above a chosen level in a disk around a young star could automatically generate a JWST or ground-telescope observation draft to be human-approved.
- Calibrate with fields that overlap. Use regions where SPHEREx has repeated deep coverage and where your survey also goes deep. These fields help pin down biases in photometric redshift and color corrections.
- Share back your validations. Publish your cross-checks of SPHEREx spectral indices against higher resolution spectra so the community can refine cuts and avoid repeating work.
Why this will reshape target selection
Astronomy has long optimized on scarcity. You spend precious time arguing for a small set of targets with narrow justification. A living spectral atlas changes that optimization. It lowers the cost of asking new questions and raises the penalty for guessing wrong. With SPHEREx, the default becomes to screen broadly, then pounce where the chemistry, dust, or redshift information says the payoff is highest. Programs can swap in fresher, better candidates between proposal drafting and actual observation because the shortlist can update weekly.
Consider exoplanet formation. Instead of picking a dozen disks from literature searches, teams can select a hundred disks whose latest SPHEREx spectra show strong water-ice signatures at specific radii. Or take cosmology. Rather than assume a uniform dust law when modeling galaxy colors, teams can use real, sky-position dependent dust templates inferred from SPHEREx to reduce biases in weak-lensing analyses. These are not nice-to-haves. They change the error bars on the final answers.
The big picture
From day one, SPHEREx looked different from past missions. It launched with the job of mapping everything, not to take the prettiest pictures. It measures colors the human eye cannot see, but that molecules and galaxies respond to with sharp signatures. It complements but does not compete with JWST, Euclid, and Rubin. And it treats data not as a yearly harvest, but as a stream that any group can tap into, week after week.
The next year is when that design pays off. A flood of spectral context will shorten the distance from hint to result. Water and organics will be mapped as environmental variables, not anecdotes. Inflation-era cosmology will gain leverage from a sky map big enough to beat down cosmic variance when combined with other surveys. And the way teams choose targets will shift from historical habit to real-time evidence.
A telescope that maps in 102 colors everywhere is a simple idea with powerful consequences. As SPHEREx keeps sweeping the sky, the atlas will get deeper and cleaner. The wider astronomy community will move faster because it can see more. And somewhere in that multicolor map, a few rare objects are already waiting for their close-up.