Euclid’s First Data Shockwave Reshapes Dark Matter Maps
Euclid’s first public data are already changing dark matter science. Uniform imaging, open archives, and AI are turning strong lensing and galaxy morphology into high-throughput discovery, with Roman poised to accelerate the pace.
The shockwave begins
On March 19, 2025, the European Space Agency and the Euclid Consortium opened a door the community has waited on for years. The mission’s Quick Data Release Q1 placed high fidelity images and catalogs from three deep fields into a public archive, with full programmatic access and documentation. If you want to see what changed, start where the science starts: the official data portal for the Euclid Q1 public release. It is not a teaser. It is a working lab bench stocked with pristine parts.
Euclid was designed to do something very particular and very hard. It aims to map the geometry of the dark universe by measuring the shapes, distances, and clustering of galaxies across a huge fraction of the sky. The first public drop covers only a sliver of what is planned, but the early impact is clear. Strong gravitational lenses are turning up by the hundreds. Morphological catalogs are arriving not for a few thousand galaxies, but for hundreds of thousands with consistent processing and rigorous quality control. Dwarf galaxies, tidal features, and bars that used to be the business of small bespoke studies are now showing up in uniform lists ready for analysis.
For a sense of how scale and cadence change methods across astronomy, compare this moment to Rubin’s real-time astronomy revolution.
This is the moment when “we will” becomes “we are.”
Why strong lensing is the early headline
Strong lensing is the phenomenon that happens when a massive foreground galaxy or cluster bends the light from a more distant galaxy into arcs, multiple images, or even a complete ring. If you have ever set a glass marble on top of a newspaper and watched the print distort and split, you have the right picture in mind. That glass marble is the foreground galaxy and its surrounding dark matter halo. The warped text is the background galaxy.
Why does lensing matter for dark matter studies? Because lensing reads out mass directly, regardless of whether that mass emits light. It gives you a map of gravitational potential, not just starlight. That is priceless if you want to test how smooth or clumpy dark matter is, how steeply mass piles up at galaxy centers, or how many small subhalos sit inside bigger halos.
Euclid changes the game in three practical ways:
- It combines Hubble-like resolution with a surveyor’s breadth. You are not hunting lenses in postage stamps. You are scanning great swaths of sky where the probability of encountering rare systems finally favors discovery.
- It delivers uniform imaging in optical and near infrared bands, which stabilizes automated searches. A machine learning model trained on Euclid data sees a consistent texture of noise and signal, field after field. That consistency lifts the purity of candidate lists.
- It releases the data quickly and openly. That accelerates replication, cross checks, and creative methods from teams that do not share a building or a funding line.
Within months of Q1, the community has already posted analyses describing a step change in lens discovery. One paper synthesized the first screening results and argued that the discovery pace seen in the quick release would scale to many tens of thousands of lenses in the full survey. Read the argument in the Euclid-led overview, Euclid strong lensing overview. The headline number is not the point. The point is that the shape of the curve has changed. Lenses are no longer rare finds. They are becoming a standard population you can sort, compare, and statistically analyze.
Consider what that enables right now:
- Subhalo census at scale. When many lenses are modeled with precision, you can detect the tiny kinks in lensed arcs that reveal embedded dark substructures. That lets you tell the difference between cold dark matter, which predicts many small clumps, and warmer scenarios, which smooth them out.
- Central density profiles without guesswork. Stellar light can mislead because feedback from star formation and black hole growth can shuffle matter around. Lensing lets you measure total mass directly and compare it with stellar and gas tracers to pin down how much redistribution has happened.
- Time delays for cosmology. A subset of lenses with multiple images of a variable source can measure the time it takes light to travel along different paths. Those delays translate into distances, which sharpen constraints on the expansion history when combined with other probes.
These are not future promises. The workflows already exist. What changes with Euclid is the sample size and the homogeneity of the data.
Galaxy morphology at industrial scale
Euclid’s early takes on galaxy structure are not just pretty pictures. They are quantitative maps built from fits to the shapes and light profiles of galaxies at different distances and in different environments. If strong lensing is the straightest road to mass, morphology is the honest diary of how galaxies grow.
The Q1 catalogs include measurements such as Sersic indices, axis ratios, and sizes together with flags that pick out features like bars, spiral arms, and tidal tails. A growing fraction of these labels comes from a combination of volunteer classifications and machine learning. Volunteers trained algorithms by answering focused questions while scanning Euclid cutouts. The result is a teaching set that lets software recognize the same features at scale and with controlled biases.
What can you do with a map like this?
- Trace the build-up of structure. The fraction of disk galaxies with strong bars varies with cosmic time and environment. Those bars torque gas inward and can feed central black holes. Watching bar fractions evolve tells you when and where inner halos gain and lose angular momentum.
- Read mergers from their signatures. Tidal tails and shells are footprints of recent interactions. Quantifying their frequency by mass and environment lets you connect galaxy growth to the rate at which halos merge in dark matter simulations.
- Follow dwarfs into the depths. Dwarf galaxies are the canaries in the dark matter mine. They are numerous, faint, and sensitive to how clumpy dark matter is. Q1 includes a systematic census of dwarfs across deep fields, which sets the stage for comparing their numbers and spatial distributions with predictions from different dark matter particle models.
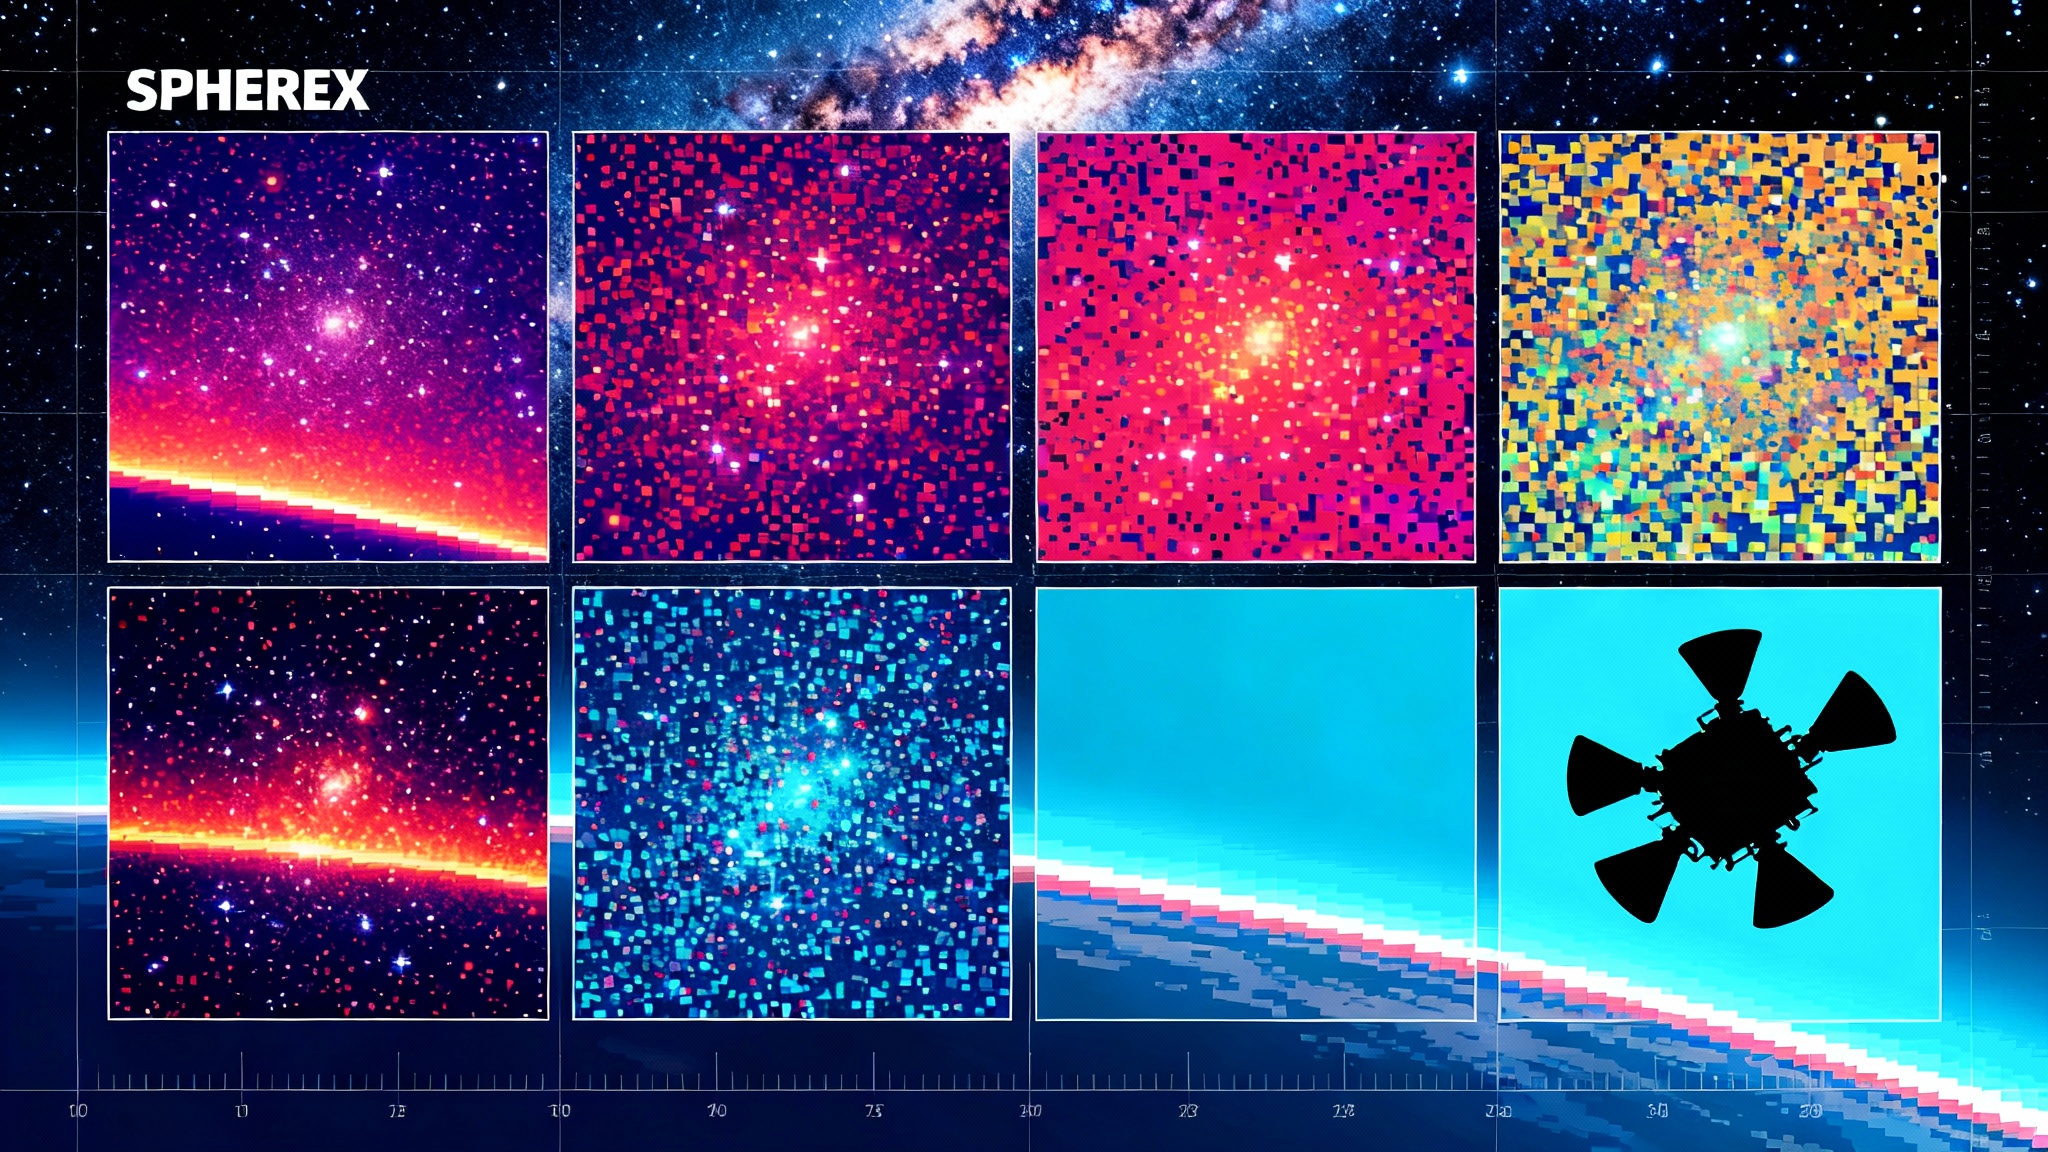
Complementary spectral context from the SPHEREx 102-color sky atlas will sharpen population gradients and dust mapping when combined with Euclid morphology.
The upshot is that morphology has moved from boutique to baseline. When a student asks whether bars are more common in dense regions, the answer can come from a query to a public table, not a year of scraping small samples from ten surveys with ten different pipelines.
From sparks to structure: what has changed for dark matter science
The biggest change is not a single result. It is the conversion of long standing questions into engineering problems with deadlines. Three examples show how the new data turns argument into measurement.
- Subhalos and the small scale crisis. Decades of debate have circled around whether simulations of cold dark matter produce too many small clumps compared with observations. With thousands of clean lenses, the community can stack the constraints from tiny distortions in arcs to measure the subhalo mass function over a wide mass range. That turns a yes-or-no debate into a curve-fitting exercise with error bars that shrink each year.
- Halo cores and feedback. Are central mass profiles steep cusps or softened cores? If they are cores, is that due to dark matter physics or to repeated gas blowouts from star formation that rearrange mass? Joint modeling of lensing mass and stellar kinematics across many systems, selected in a uniform way, can separate these effects by looking for trends with star formation rate and environment.
- Satellites and anisotropy. Do satellite galaxies align in thin planes or distribute isotropically around hosts? Do they prefer certain directions set by large scale structure? Euclid’s consistent depth and resolution in the deep fields make it practical to answer those questions not for a few famous systems, but for thousands of hosts and tens of thousands of satellites.
In every case, the critical advance is statistical power plus controlled systematics. You do not need to build a perfect model for an individual exotic object. You need reliable selection functions and repeatable pipelines across a large, transparent sample. That is what the Q1 architecture begins to deliver.
The open data and AI playbook
Open data is only useful if you can do something with it by the end of the week. Euclid’s early releases lean into that idea with clear documentation and machine readable access. Here is a practical plan that has worked for early adopters and is ripe for reuse.
- Start with a narrow, falsifiable question. For example, “What is the bar fraction for massive disk galaxies at intermediate redshift in field versus group environments?”
- Pull a reproducible subset. Use the deep field catalogs and image cutouts for a controlled sky area. Limit your first pass to the quality flags in the morphology tables that have the simplest selection functions.
- Stand on proven labels. Combine volunteer trained morphology labels with Sersic fits and colors. Do not invent a new classifier if an existing one with known biases gets you within 5 percent of your target uncertainty.
- Use a lens finder or fine tune your own. If you work on strong lensing, start with public convolutional models that specialize in arc detection trained on Euclid-like data. Freeze most layers and tune on Euclid cutouts with fixed augmentations. That stabilizes performance without overfitting to spurious artifacts.
- Cross match with spectroscopy. Where you need redshifts, tie in existing spectroscopy from public surveys. For photometric redshifts, use the provided estimates but propagate their full probability distributions into your inference.
- Publish your pipeline. The deliverable is not just a plot. Release your notebook, container, and configuration. If someone else can run your code against the same Q1 tables and get the same numbers, you have done it right.
Expect improving space-to-ground bandwidth to reduce latency for future datasets, especially as deep-space laser internet begins to scale.
Roman is the accelerator
NASA’s Nancy Grace Roman Space Telescope is entering its final stretch of testing with a target launch window that begins in late 2026 and extends to no later than May 2027. Roman will image wide fields of the sky in the near infrared with exquisite stability and will deliver spectroscopy over huge areas. The design choices that make Roman powerful for dark energy also make it a perfect partner for Euclid.
Here is how the synergy plays out:
- Depth meets breadth. Roman will go deeper in the near infrared over smaller regions while Euclid tiles much larger areas to shallower depth. Overlaps let you calibrate photometric redshifts and improve star galaxy separation where Euclid alone is ambiguous.
- Spectroscopy at scale. Roman’s wide area spectroscopy will provide secure redshifts for lens galaxies and for lensed sources in fields Euclid images. That locks down mass models and time delay cosmography with fewer assumptions.
- Morphology in multiple colors. Combining Euclid’s sharp visible light imaging with Roman’s infrared views gives you stellar population gradients and dust maps, which help disentangle mass to light ratios from true mass structure when modeling lenses.
- Time domain lenses. Roman’s survey cadence will catch variability in multiply imaged sources. Euclid’s wide context images help you model the mass distribution along the line of sight. Together they boost the yield and quality of time delay lenses.
For teams planning three year projects, the message is clear. Start your Euclid analyses with configurations that can ingest Roman cutouts and spectra when they arrive. Design your validation so that dropping in Roman data tightens uncertainties without rebuilding the pipeline.
What to watch in the next releases
Euclid’s Q1 was the foot in the door. The next public releases will scale area, add epochs in the deep fields, and improve calibrations as the processing pipelines mature. On the lensing front, expect the candidate lists to move from hundreds to many thousands with better completeness estimates and public lens models for subsets. On the morphology side, expect the catalogs to extend to fainter limits with more confident feature flags and cross matches to deeper infrared data.
Several specific milestones to track:
- Wider shear maps with verified systematics. Weak lensing shear catalogs that pass end to end null tests will allow precision clustering and galaxy galaxy lensing measurements on large scales.
- Public model suites for benchmark lenses. A curated sample with community contributed models will make method comparisons fair and efficient.
- Expanded dwarf galaxy lists across more environments. That will firm up the counts used to test warm dark matter and self interacting dark matter scenarios.
- Harmonized photometric redshifts. As more bands and deeper stacks come online, the photo z estimates will tighten, which improves every inference that depends on distance.
None of these are speculative. They are natural extensions of what Q1 already demonstrates, and they are consistent with the mission’s timeline.
The bottom line
Euclid’s first public data have turned strong lensing and galaxy morphology from artisanal fields into assembly lines for discovery. The change is not just scale. It is structure. Uniform imaging over large areas, fast open releases, and a culture of machine assisted classification are compressing the time from raw pixels to publishable inferences.
For dark matter science, that means we can finally measure the statistics that distinguish between smooth and clumpy scenarios, watch halo profiles change with feedback rather than argue about a handful of case studies, and test satellite distributions with numbers large enough to care about outliers. For the broader community, it means a leveling effect. A small, focused team with a good question and a careful pipeline can now contribute frontier results without privileged access.
The payoff will only grow as the survey expands and as Roman adds depth and spectroscopy. The smart move is to build pipelines that are honest about their uncertainties, designed to accept Roman data the moment it arrives, and packaged so that anyone can push the same button and get the same answers. If you do that, the first-data shockwave will not be a single thunderclap. It will be the steady hum of a factory turning raw photons into maps of the invisible structure that shapes everything we see.