SenNet’s 2025 Atlas Breaks the Biomarker Bottleneck
A standardized, tissue specific multi-omics map of senescent cell states puts validated biomarkers into the hands of researchers. The result is a clear path to precision diagnostics, smarter trials, and the next wave of senotherapeutics.
What just happened
This year the National Institutes of Health Cellular Senescence Network, often called SenNet, released a computational multi-omics atlas of senescent cell states across human tissues. Think of it as a high resolution weather map for aging biology. Instead of showing wind and rain, it shows which cells in which tissues carry the molecular hallmarks of senescence, how intense those signals are, and how they change with age, disease, and intervention. For background on the consortium, see the NIH SenNet program.
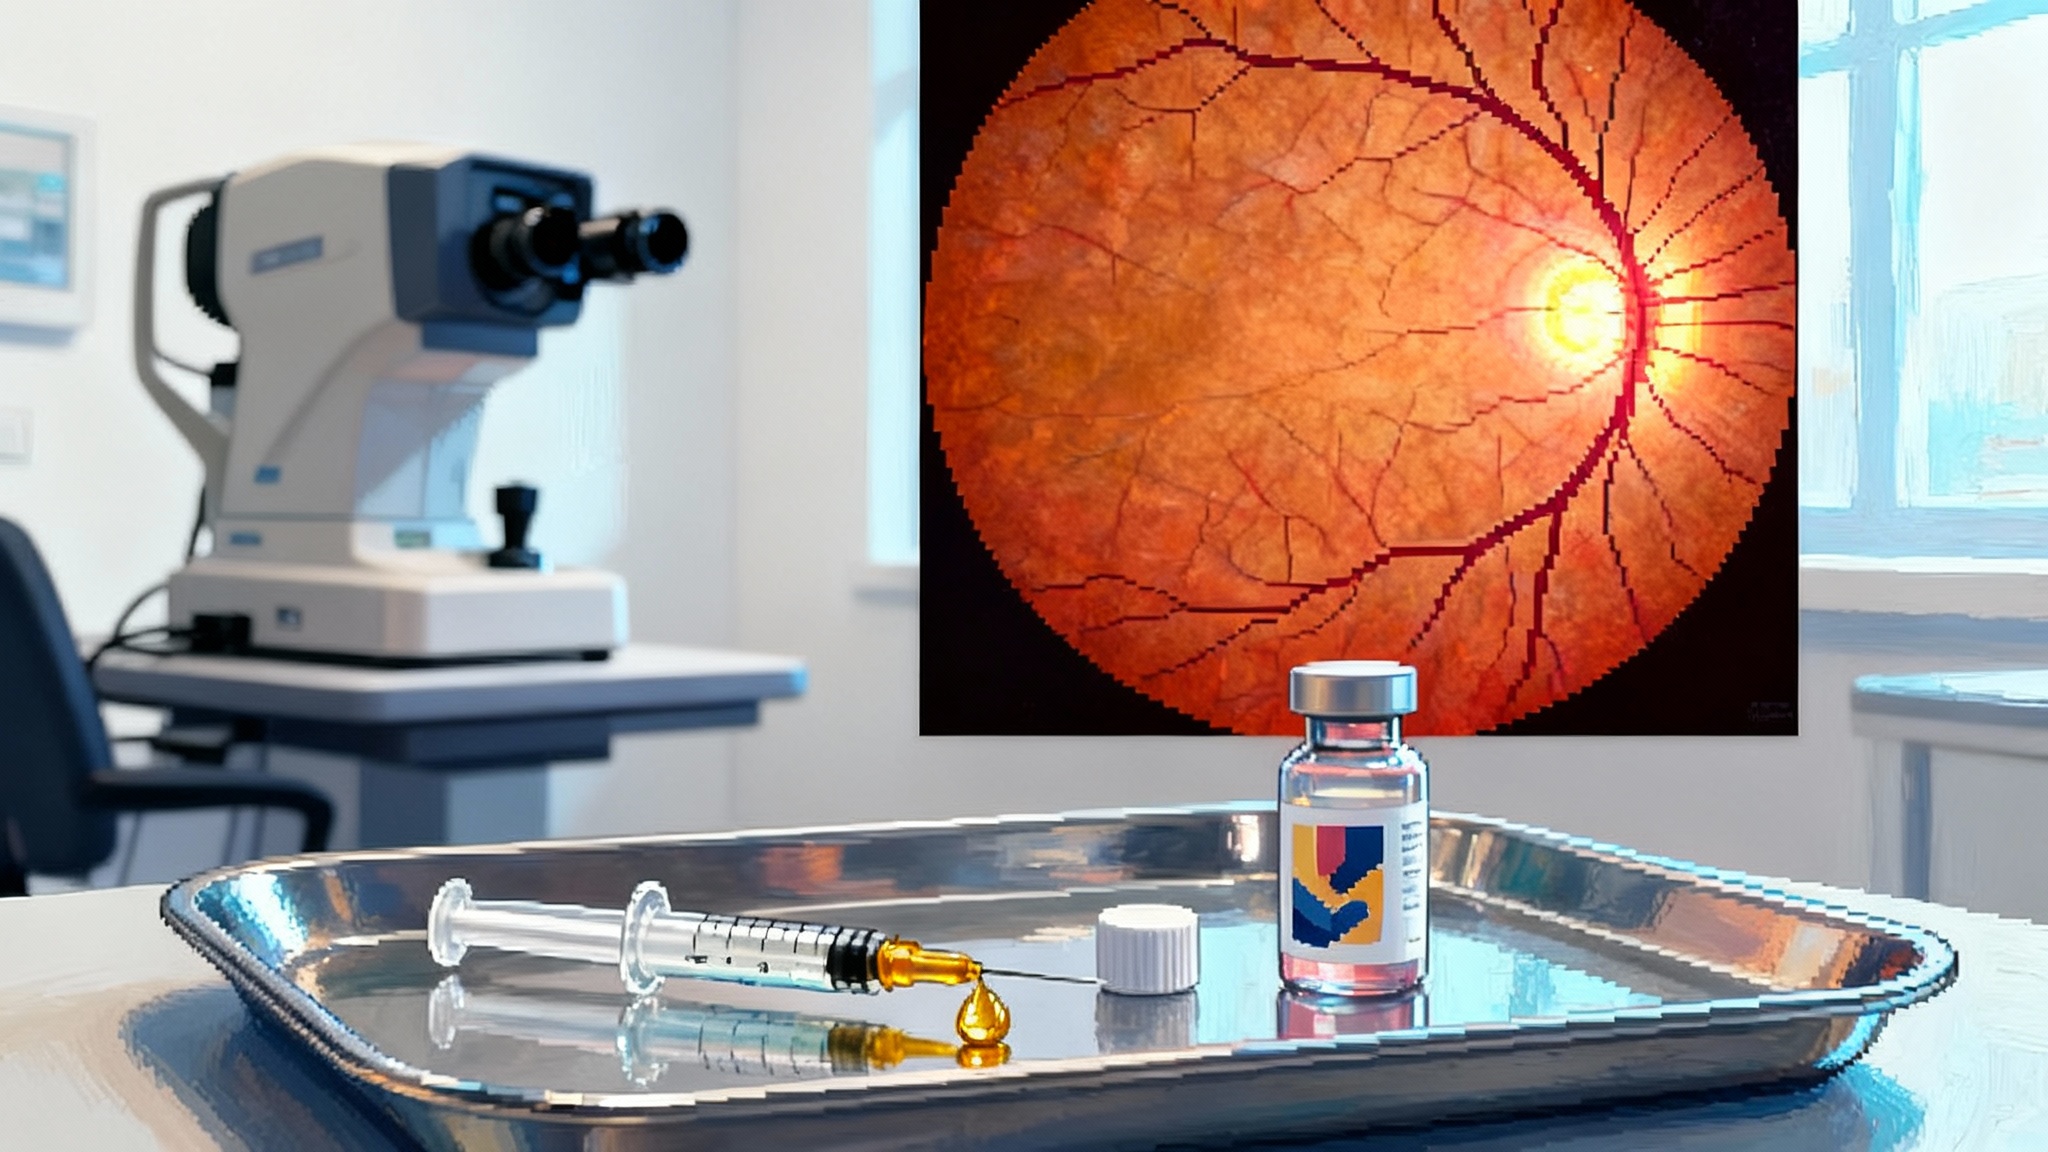
If you work in longevity, you have felt the choke point. We have drugs that aim to clear or tame senescent cells, called senolytics and senomorphics. Early clinical steps, such as the UBX1325 eye readouts, show what is possible yet also expose the need for better markers. We have plausible mechanisms, from the senescence associated secretory phenotype to the loss of lamin B1, and to p16 and p21 pathway activation. Yet clinical progress stalls because we have lacked standardized, tissue specific biomarkers that regulators, clinicians, and patients can trust. Without common yardsticks, trials rely on piecemeal markers that vary by lab, by tissue, and by method. The SenNet atlas changes that by unifying signals from transcriptomics, chromatin accessibility, proteomics, and spatial imaging into coherent signatures that any lab can reproduce.
Why multi-omics makes a difference
Senescence is not a single light switch. It is more like a dashboard of warning lights that differ by tissue and by trigger. A cartilage chondrocyte that turns senescent after mechanical stress does not look exactly like a lung fibroblast that turned senescent after viral injury. A blood based assay that works for one may miss the other. Multi-omics solves this by treating each layer as a clue, then combining clues into a case file that is stronger than any single witness.
Here is what that looks like in practice:
- Single cell RNA sequencing identifies the transcriptional program of senescence in each tissue, including cell cycle arrest signatures and inflammatory cytokines.
- Chromatin profiling shows which genomic regions open or close during the transition into senescence, which helps separate cause from consequence.
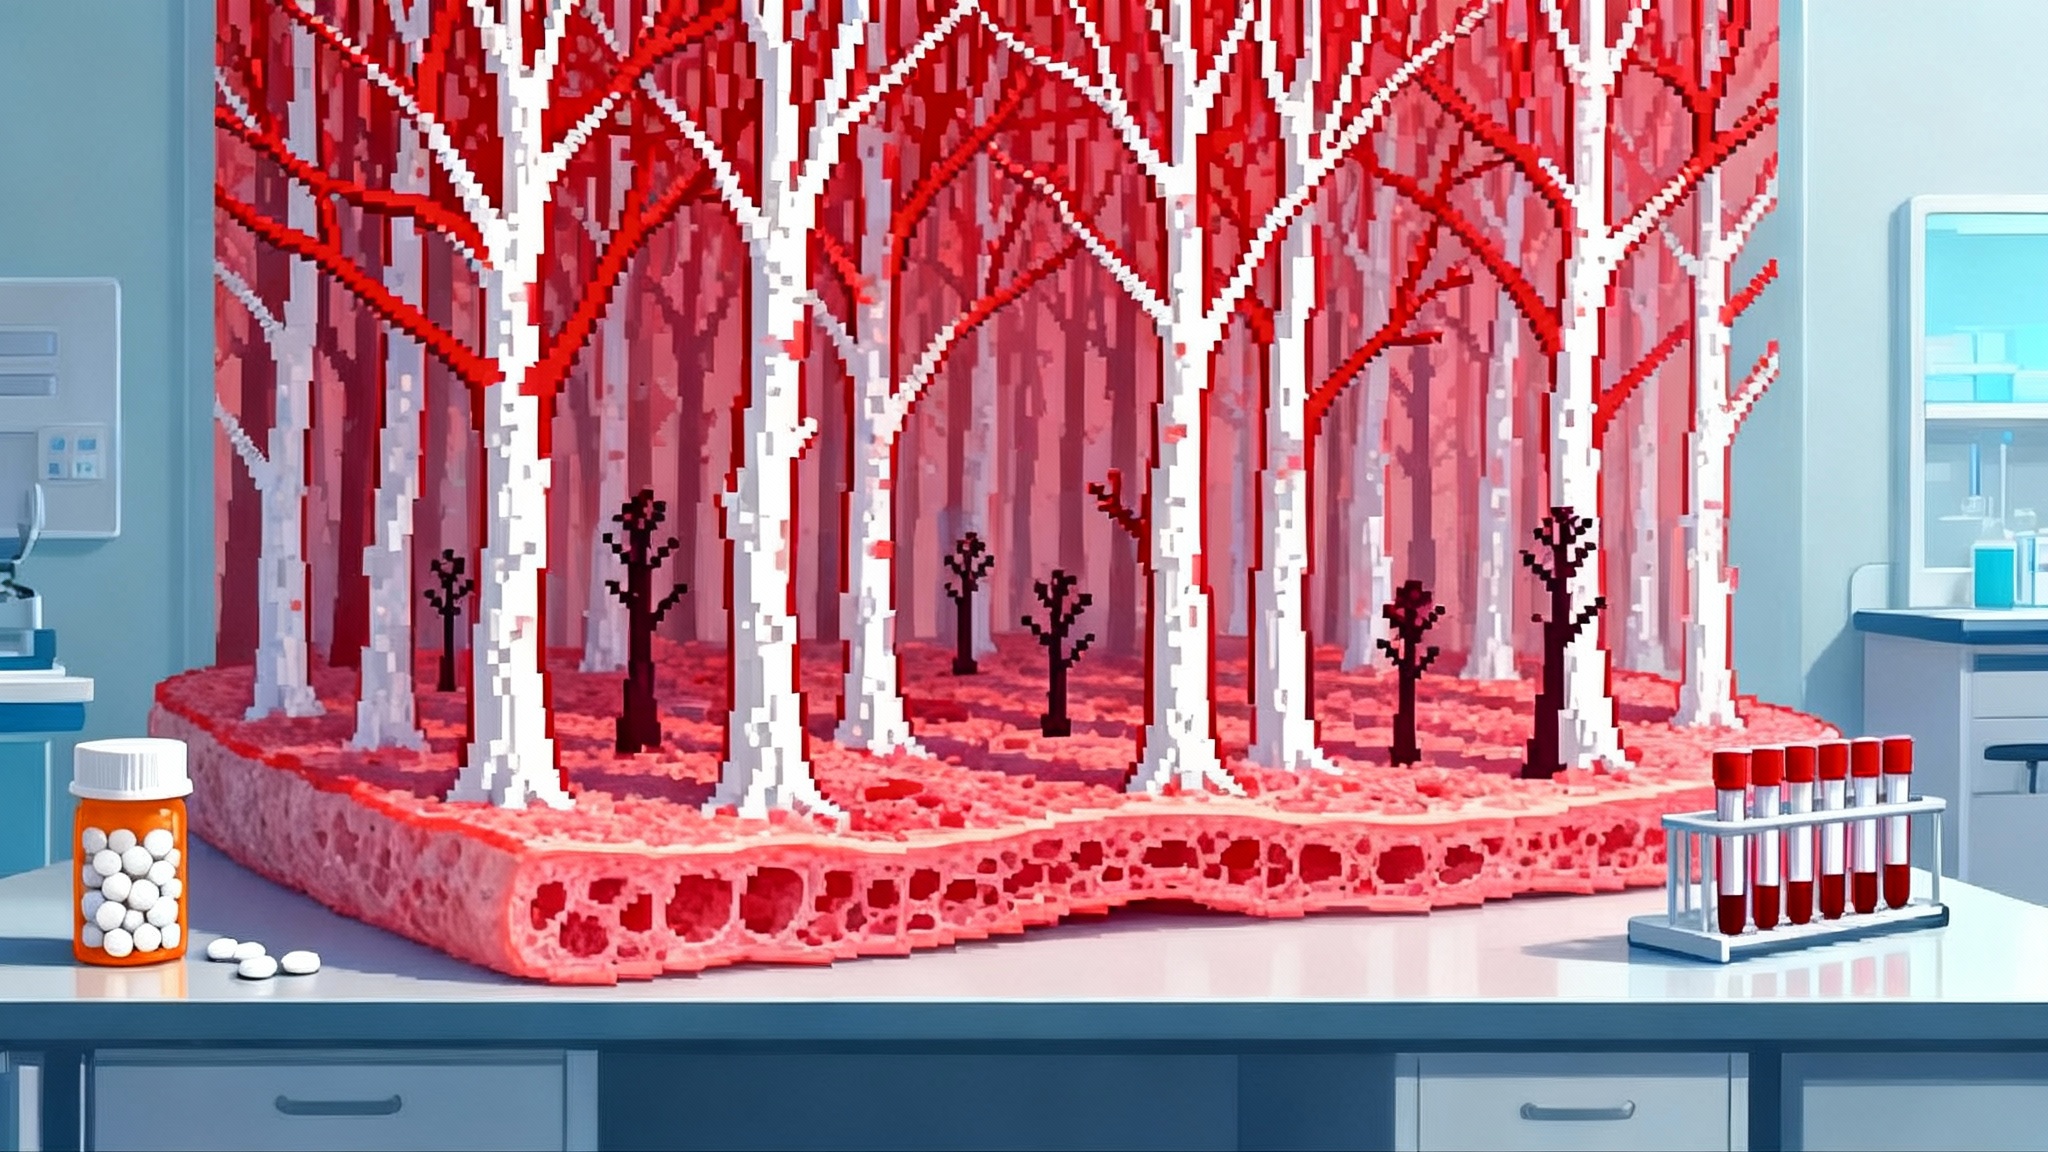
- Proteomics and secretome measurements capture the proteins that actually leave the cell and circulate in blood or lymph, the practical place to draw clinical samples.
- Spatial imaging maps where these cells sit in the tissue architecture, which matters because a few senescent cells near a nerve or vessel can have an outsized effect.
The atlas merges these views into tissue specific patterns. Instead of one generic senescence score, we now have cartilage signatures, liver signatures, skin signatures, and more, each tied to a set of measurable features with clear thresholds. That is the kind of standard that turns a research idea into a clinical endpoint.
From signatures to endpoints you can use
To get trials moving, we need endpoints that are sensitive, specific, and practical. The atlas supports each of those goals.
- Sensitivity: By combining orthogonal features, the composite signal rises above noise. If messenger RNA is faint in a given tissue, the protein panel or the chromatin signal still carries the weight.
- Specificity: Tissue specific fingerprints distinguish true senescence from lookalikes such as quiescence or transient stress responses. That reduces false positives that once plagued blood tests built on a single cytokine.
- Practicality: The atlas highlights which features survive real world sampling. If a protein degrades in standard transport, it is flagged. If a gene panel works on formalin fixed tissue, it is noted. This translates directly to clinical workflows.
A useful way to think about the opportunity is the low density lipoprotein analogy. Cardiovascular medicine became predictable when low density lipoprotein provided a quantitative, actionable readout. Longevity needs an equivalent for senescence. The atlas does not give us a single number, because biology is more diverse here. It gives us a kit of validated panels and a way to compute a composite score that can be compared across labs. That is enough to move from exploratory studies to registrational trials.
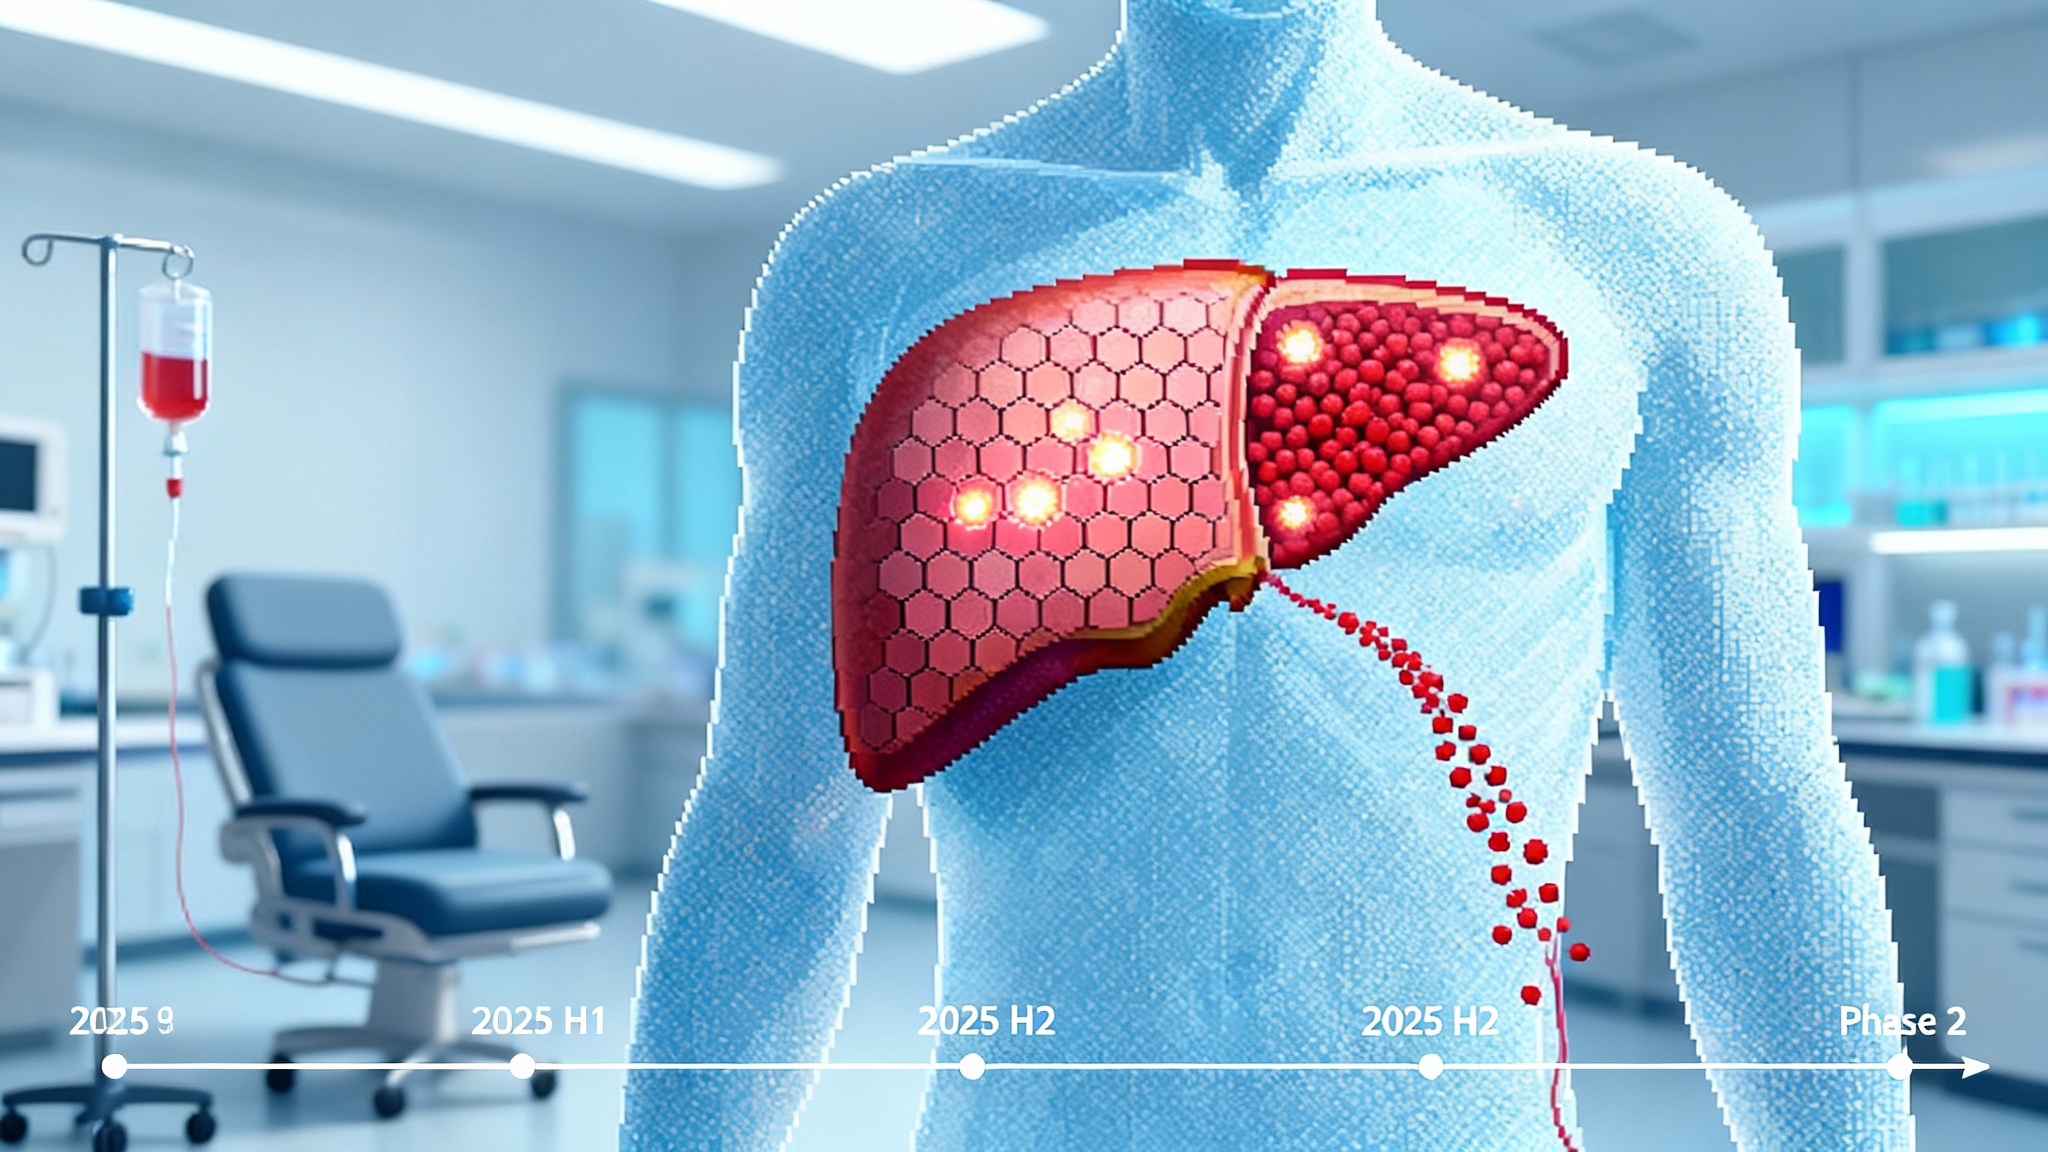
A 24 month roadmap to impact
The question now is how to turn this into results in two years, not ten. Here is a realistic plan that different players can execute in parallel.
- Assay translation to the clinic
- Build Clinical Laboratory Improvement Amendments validated assays for two or three tissues where senescence burden ties most strongly to outcomes, for example cartilage in knee osteoarthritis, retinal pigment epithelium in age related macular degeneration (see partial reprogramming eye trials), and lung fibroblasts in fibrotic disease.
- Use the atlas panel directly, but prune it to the smallest set that maintains performance in real samples. Focus on minimal sample volume, same day ship stability, and automated analysis pipelines.
- Publish assay precision, limits of detection, and cross lab reproducibility using common reference materials the community can buy.
- Patient selection at scale
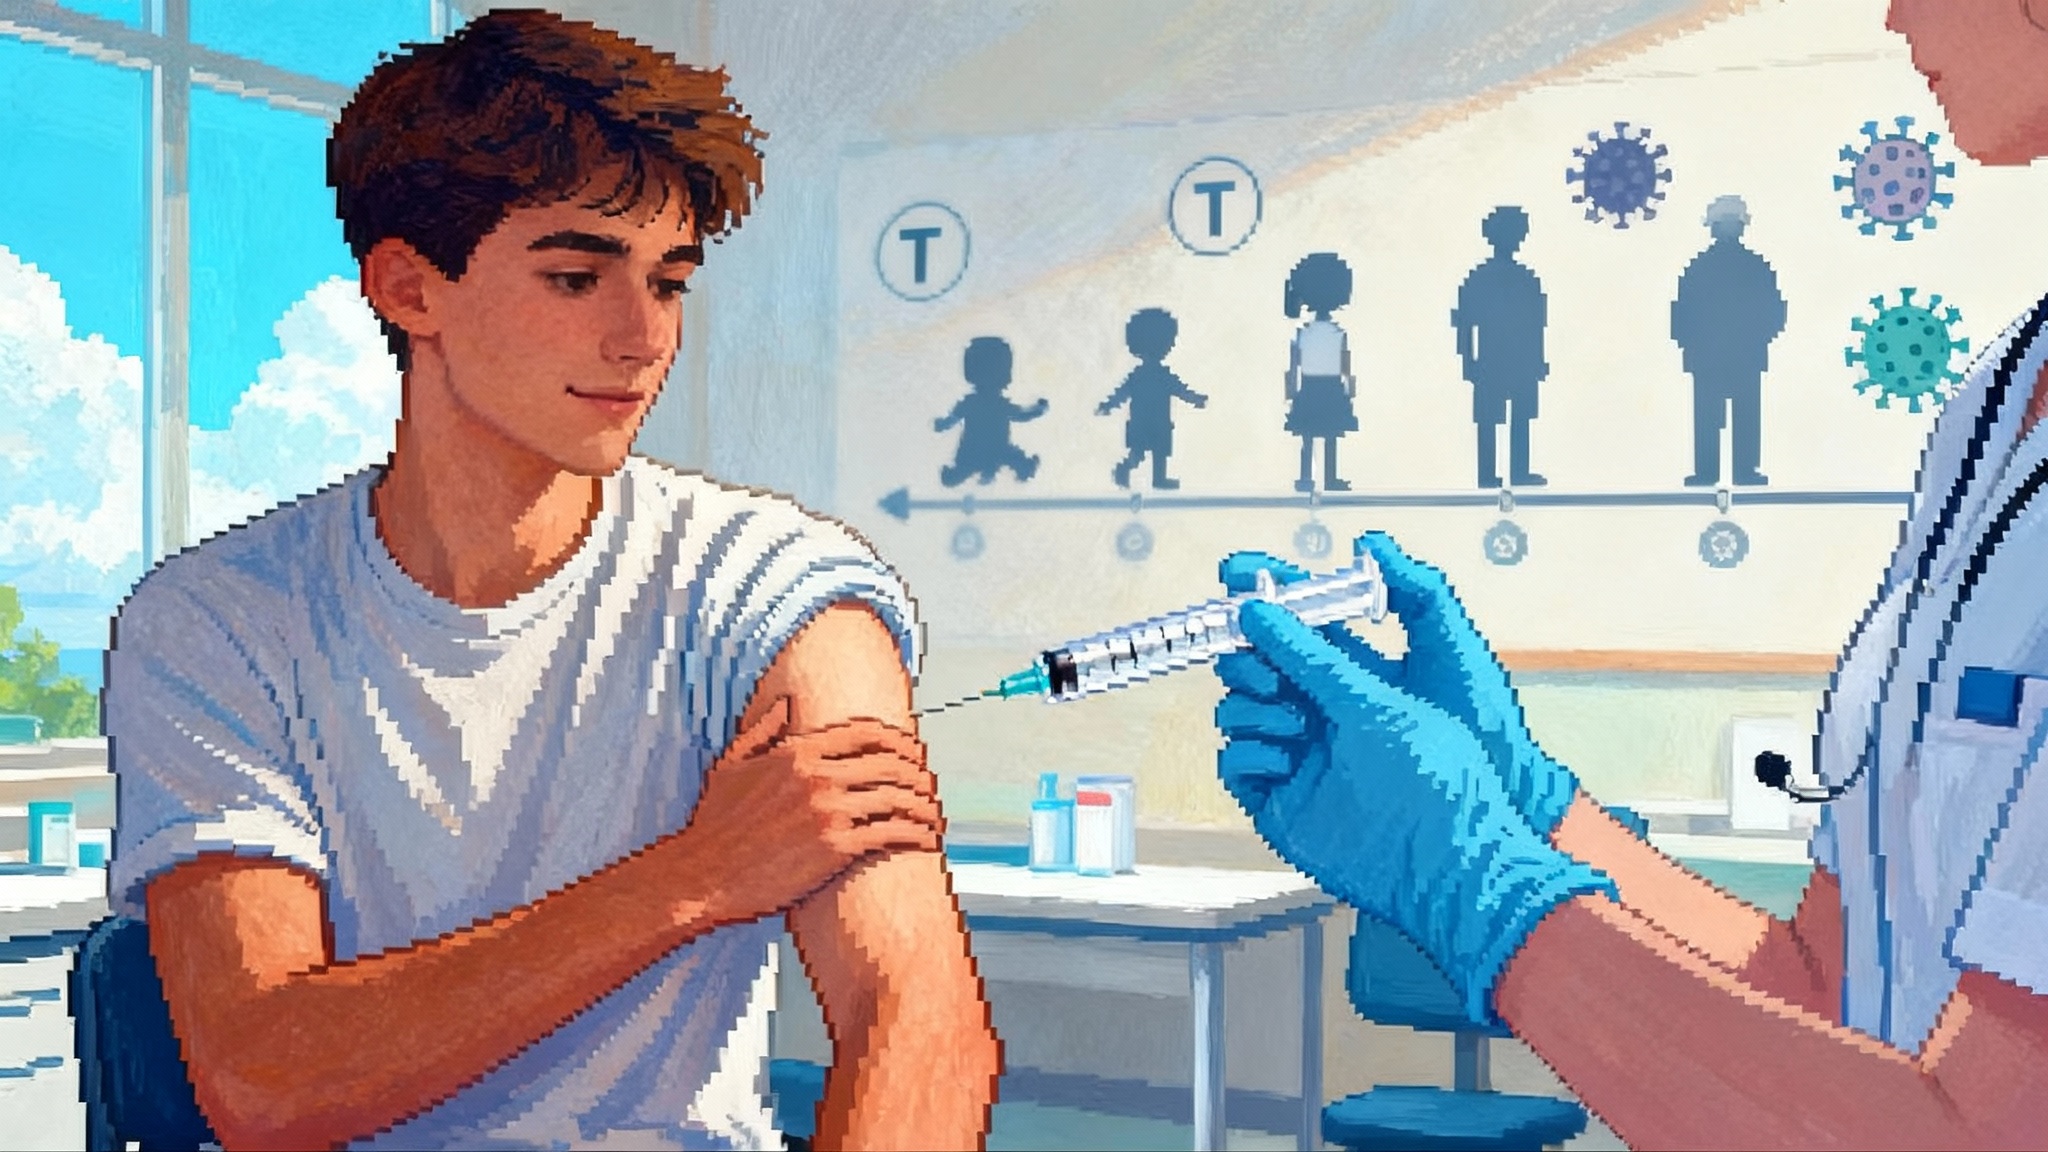
- Enroll only patients who cross a tissue specific senescence threshold. This mirrors oncology where programmed cell death protein 1 or human epidermal growth factor receptor 2 positivity gates trial entry and drives effect sizes.
- For tissues that are hard to biopsy, deploy atlas derived peripheral proxies, for example secreted proteins or exosome cargo, that were mapped from tissue to blood during atlas construction.
- Measurable pharmacodynamic change
- Pre register a composite endpoint called the Senescence Burden Index that combines tissue, spatial, and circulating signals into a single trajectory per patient. Define success as a prespecified percentage drop at day 28 and day 84.
- Pair biological change with a functional measure that matters to patients, for example cartilage thickness and pain in osteoarthritis or visual acuity in ophthalmology, and pre specify the correlation you expect based on atlas data.
- Regulator engagement
- Submit the composite endpoint to the FDA Biomarker Qualification Program with cross site reproducibility data. Ask for fit for purpose use in early phase studies and for enrichment in pivotal trials.
- Align on sample handling and analysis standards so that data from different sponsors can be pooled later for meta analysis.
What this unlocks for companies
Drug developers have struggled to show that a senotherapeutic did what it was designed to do inside the target tissue. The atlas changes three pain points at once.
- Target engagement: You can now confirm that your drug reduces the tissue specific signature, not just a generic inflammatory marker. This is crucial when a drug works locally, for example in the eye or the joint space.
- Dose finding: Instead of guessing at dose, run a short titration and pick the lowest dose that moves the Senescence Burden Index by a predetermined margin without safety concerns.
- Go or no go decisions: Stop programs that fail to reduce the signature in humans even if animal data looked good. Invest deeper in programs that produce large, consistent signature shifts and align with functional gains.
Companies across the spectrum can act. Small biotechnology startups can design lean trials with biomarker rich windows that answer target engagement fast. Larger companies can structure companion diagnostics from the start, combining a drug with an assay that the atlas already validates. Investors can condition milestone payments on pre agreed signature changes, so capital moves to programs with real biological traction.
A new discipline for trial design
Most trials in aging biology suffer from four design flaws. The atlas helps fix each one.
- Vague inclusion criteria: Historically we enrolled anyone with a clinical label, for example osteoarthritis, which mixes patients with different underlying biology. Now we enroll patients who cross a tissue specific signature threshold that is tied to the mechanism of action.
- Hand picked endpoints: Sponsors cherry picked secondary outcomes after the fact. Now the composite index and a disease specific functional readout are pre registered and mechanistically linked.
- Underpowered studies: Without a strong signal, trials require huge sample sizes. The atlas raises signal to noise by constraining the biology and by providing continuous quantitative measures.
- Irreproducible assays: Lab developed tests drift across sites. The atlas enables reference materials and standard operating procedures that anchor results over time.
For sponsors, the playbook is simple. Start with a phase 0 or phase 1b study. Take baseline tissue and blood samples, dose your intervention, and resample at a short interval when pharmacology tells you the effect should appear. Compute the Senescence Burden Index and show the expected drop. If you do not see it, do not proceed to large studies on hope. If you do see it, greenlight a phase 2 trial with the same biomarkers plus a patient centered outcome. This avoids years of ambiguous results.
What the atlas means for diagnostics
Diagnostics companies can finally build products that clinicians want to order. There are three layers of opportunity.
- Tissue informed blood tests: By tracing secreted proteins and vesicle cargo from specific tissues, the atlas supports blood tests that report the burden of senescence in cartilage, liver, or skin. Clinicians can monitor burden over time without a biopsy.
- Digital pathology: A standard set of staining and imaging markers, along with scoring rules derived from spatial maps, can turn a routine histology slide into a quantitative senescence score. That feeds directly into surgical decision making.
- Companion diagnostics: For drugs that only work when the target tissue is senescent, an on label assay solves the payer problem and ensures patients who will not benefit are spared risk and cost.
For near term revenue, focus on conditions with existing clinical decision points, for example selecting patients for joint replacement, choosing among intravitreal therapies in retinal disease, or prioritizing candidates for lung transplant evaluation. Add the biomarker as a risk stratifier and show that it changes the choice and improves the outcome.
Standards and quality control
The atlas does not remove the need for discipline. It provides the blueprint, not the house. To make the data trustworthy across labs and time, the field should adopt three practical standards in the next year.
- Common reference materials: Produce pooled serum and tissue sections with defined senescence levels so that every lab can verify accuracy monthly. Make these materials affordable and widely available.
- Preanalytic rules: Define exactly how samples are collected, stored, and shipped, including temperature, time limits, and anticoagulants. Publish stability curves so failure modes are known.
- Transparent algorithms: The composite score must be explainable. If a software update changes the score, document the change and its effect on thresholds.
These steps sound boring, but they are how oncology and cardiology turned complex biology into routine clinical practice.
The limits and how to work within them
Senescence is not always harmful. It assists in wound healing and in limiting cancer under some conditions. A therapy that erases senescence without discrimination may blunt a useful response. The atlas helps here by exposing context. If a tissue shows a transient senescence pattern during healing, the composite score can reveal that time course and suggest when to avoid intervention. It can also help discover drugs that reshape the senescent program rather than destroy the cells, which might be safer in certain organs.
Another risk is overfitting to the atlas. The first version is comprehensive, but not omniscient. Edge cases will appear in rare diseases, in extreme ages, and in non human models. The safe path is to treat the atlas as a living resource, validate your panel in your population, and share back results so the resource evolves.
Practical steps for the next quarter
If you are a sponsor planning a study:
- Pick one tissue where your mechanism is strongest and map your preclinical data to the corresponding atlas signature.
- Pre register the Senescence Burden Index and a functional outcome that patients care about.
- Lock a short pharmacodynamic window with paired sampling. Design the schedule around your drug kinetics, not around clinic convenience.
If you are a diagnostics company:
- Stand up a Clinical Laboratory Improvement Amendments validated assay for one tissue, not five. Win one clear clinical use case, then expand.
- Offer transparent analytics with a clinician facing report that shows both the composite score and the component markers so doctors can build intuition.
If you are a regulator or payer:
- Invite early submissions that use atlas derived endpoints and ask for standardized reproducibility data up front. This aligns incentives and speeds safe adoption.
If you are a researcher:
- Use the atlas to generate hypotheses that are falsifiable in humans within months, for example whether a topical agent reduces a skin specific signature after ultraviolet exposure.
Beyond aging into mainstream medicine
The atlas will matter outside longevity. Many chronic diseases collect pockets of senescent cells that drive symptoms. Pulmonary fibrosis, diabetic complications, osteoarthritis, and macular degeneration all carry senescence fingerprints. Once assays exist and thresholds are validated, the same framework can guide when to intervene, how hard to push, and when to stop. It also enables combination therapy. For example, one drug could reduce the inflammatory secretome while another encourages healthy tissue remodeling, with the composite score confirming that the balance is right. For inflammation focused strategies, see how necroptosis blockers enter trials.
For patients, this means moving from generic advice to personalized monitoring. Your doctor might soon track a liver specific senescence score the way they track hemoglobin A1c in diabetes. If your score rises, you get an intervention tailored to the tissue and to your risk profile. If it falls, you celebrate a real biological change, not just a feeling.
The bottom line
The field has waited for a unifying resource that turns a fuzzy biological concept into a practical clinical tool. SenNet’s computational multi-omics atlas is that resource. It replaces one size fits all markers with tissue aware signatures that labs can run and regulators can evaluate. It gives drug developers the ability to prove target engagement, gives diagnostics companies a product patients and clinicians can use, and gives regulators a path to consistent decisions. Most importantly, it gives trials a way to move beyond hope and toward evidence.
The next 24 months will test whether we can execute. The atlas lowers the barrier, but real progress still depends on disciplined assay development, honest go or no go calls, and collaboration across companies and institutions. If the community steps up, the biomarker bottleneck that has slowed senotherapeutics for a decade will finally open. When that happens, aging biology starts to look less like philosophy and more like engineering, which is exactly what patients need.