Agent Observability Arrives, Building the Control Plane for AI
Agent observability just moved from slideware to shipped software. With OpenTelemetry traces, Model Context Protocol, and real-time dashboards, enterprises can turn experimental agents into governed, measurable systems and prove ROI through 2026.

Breaking: Observability is the real AI product this year
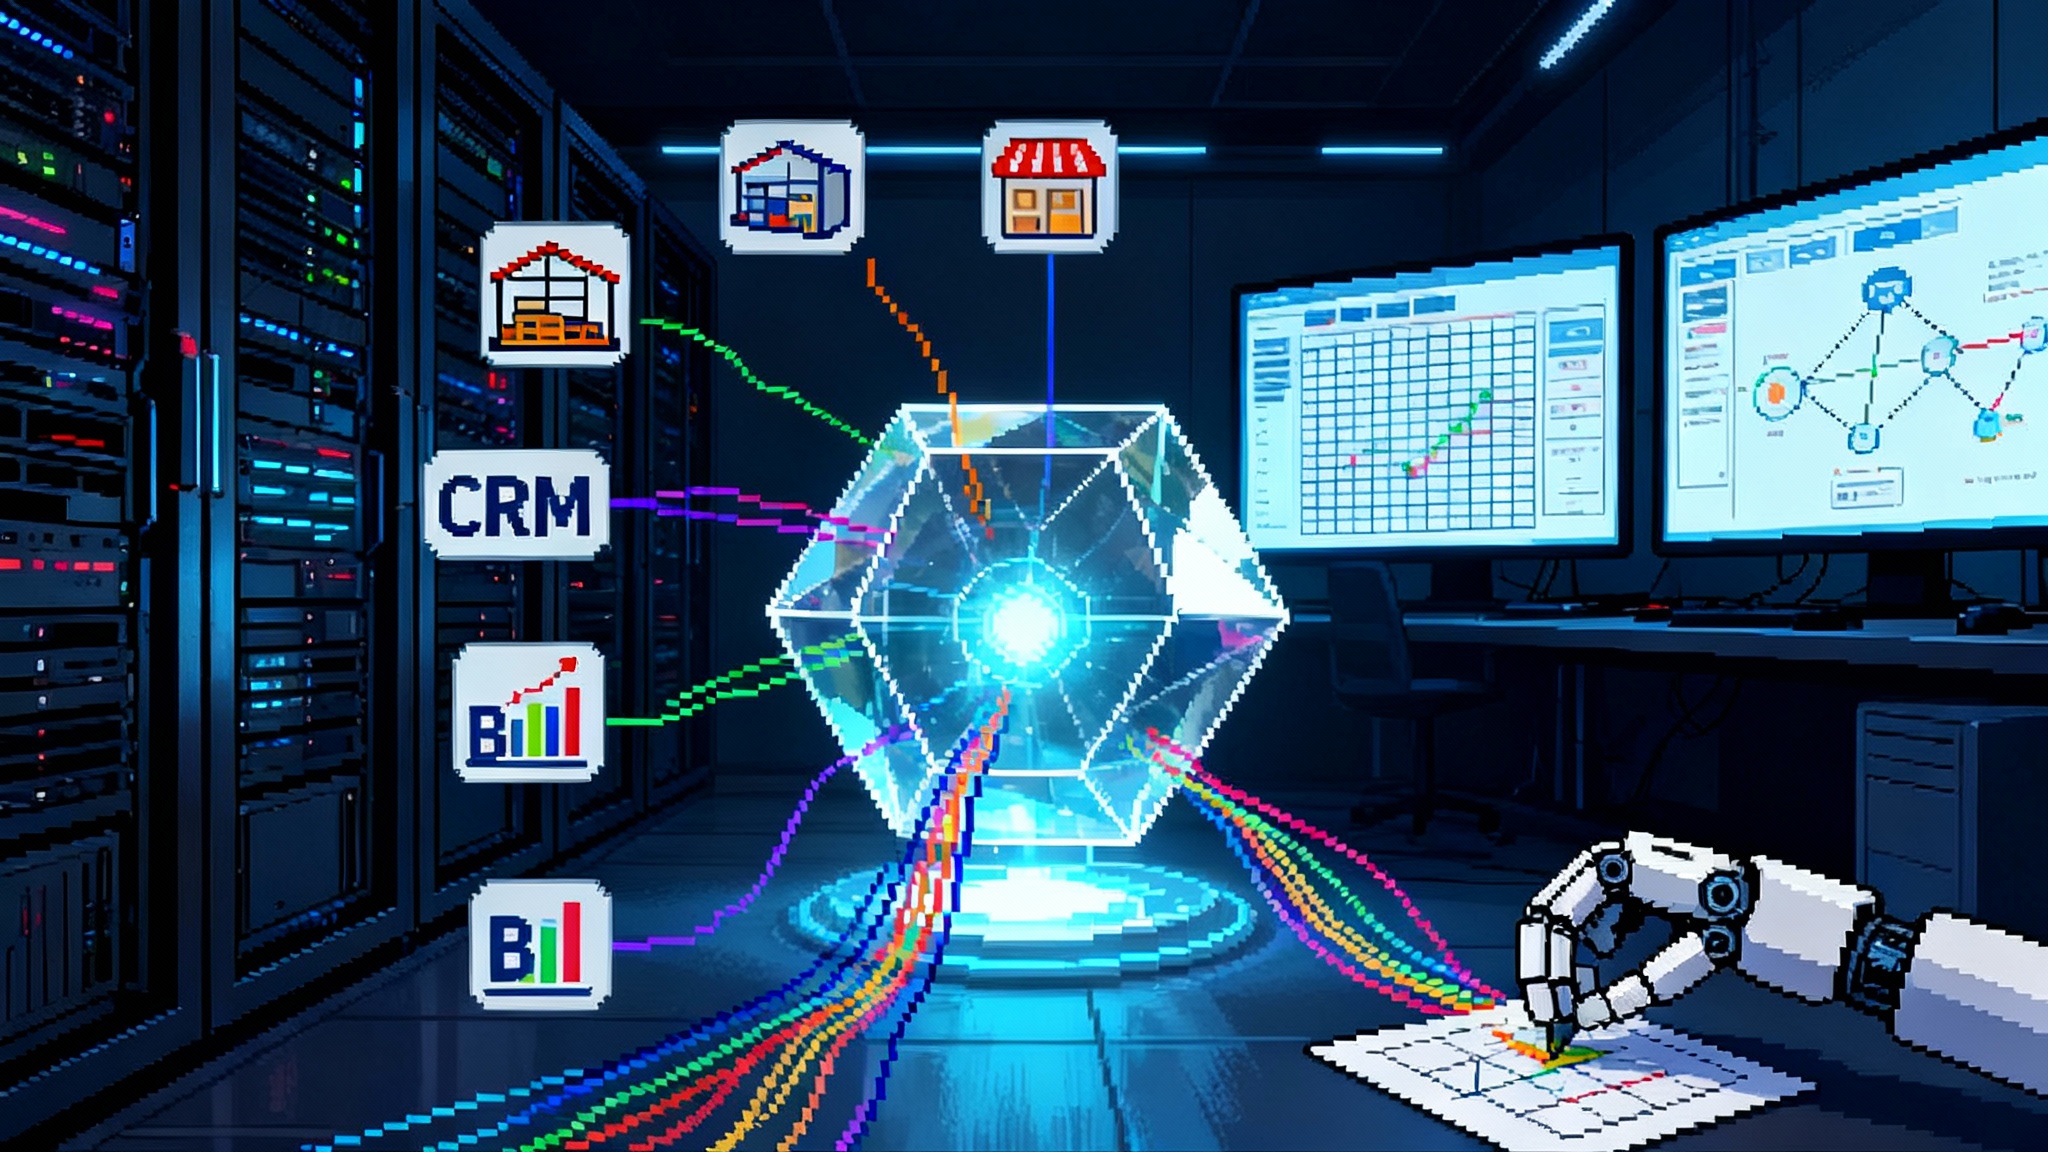
A quiet but important shift just moved from slideware to shipping software. In June, Salesforce announced Agentforce 3 with a Command Center that surfaces live traces, health, and performance for enterprise agents, complete with Model Context Protocol support and OpenTelemetry signals in the Salesforce Agentforce 3 announcement. Around the same time, LangSmith added end-to-end OpenTelemetry ingestion and made it trivial to trace applications that use the OpenAI Agents software development kit. Governments, for their part, are no longer speaking in generalities. The U.S. Artificial Intelligence Safety Institute published hands-on agent hijacking evaluations that move past theory into adversarial reality in its AISI agent hijacking evaluations.
The through line is simple. If agents are going to run your workflows, you need the same visibility and control you expect for microservices or data pipelines. Bigger models help, but they do not tell you why an agent failed, when it went off script, or where your return on investment is hiding. Observability does.
The one-paragraph summary
Agent observability has become the missing layer that lets businesses scale from clever pilots to reliable production. Recent releases added first-class tracing, dashboards, alerts, and open standards such as OpenTelemetry and Model Context Protocol. With these in place, teams can see agent plans and actions in real time, detect security risks such as agent hijacking, run continuous evaluations, and tie everything to cost and outcome metrics. The stack now looks more like a control plane than a model catalog, and the companies that adopt it will get compounding benefits through 2026: less downtime, faster iteration, safer automation, and clearer proof of value. The playbook is straightforward. Instrument first, normalize traces, define service-level objectives for agents, wire alerts where humans work, and enforce policy at the tool boundary. Do this, and agents stop being mysterious helpers and start being measurable teammates.
From model-first to control-plane-first
For two years the story of enterprise AI was model quality and benchmarks. That era produced the raw capability we needed, but it left teams flying blind in production. Agents are now multi-step systems that plan, call tools, route to other agents, and ask humans to confirm actions. The old mindset measured tokens and accuracy. The new mindset measures runs, spans, and outcomes. For deeper context on agent durability, see long-haul AI agents with Claude Sonnet 4.5.
Think of the transition like moving from a faster engine to a cockpit. A bigger engine makes a plane go fast, yet the cockpit tells the pilot what is actually happening, when to intervene, and how to land. Model-centric thinking optimized horsepower. Agent observability gives you the instruments, the radio, and air traffic control.
Here is what changes when you flip that mental model:
- You care less about a single best model, and more about how models, tools, and human steps compose into workflows that meet an objective.
- You debug with traces and spans, not with vibes. Every tool call, guardrail, retry, and human approval becomes inspectable.
- You manage by service-level objectives, not anecdotes. Success rates, costs, latency, escalations, and safety incidents are visible on a wallboard.
- You enforce policy at the edges. Tool permissions, data scopes, and environment isolation become first-class controls.
The new observability stack for agents
A control plane for agents has seven layers. Some products will span multiple layers, but the responsibilities are distinct.
1. Instrumentation and trace propagation
- OpenTelemetry collectors or native SDK tracing capture runs, steps, tool calls, prompts, responses, and guardrail decisions.
- Standard keys for agent context make traces portable across vendors.
- Example components: OpenTelemetry, OpenLLMetry conventions, OpenAI Agents SDK built-in tracing, LangSmith exporters.
2. Event normalization and sessionization
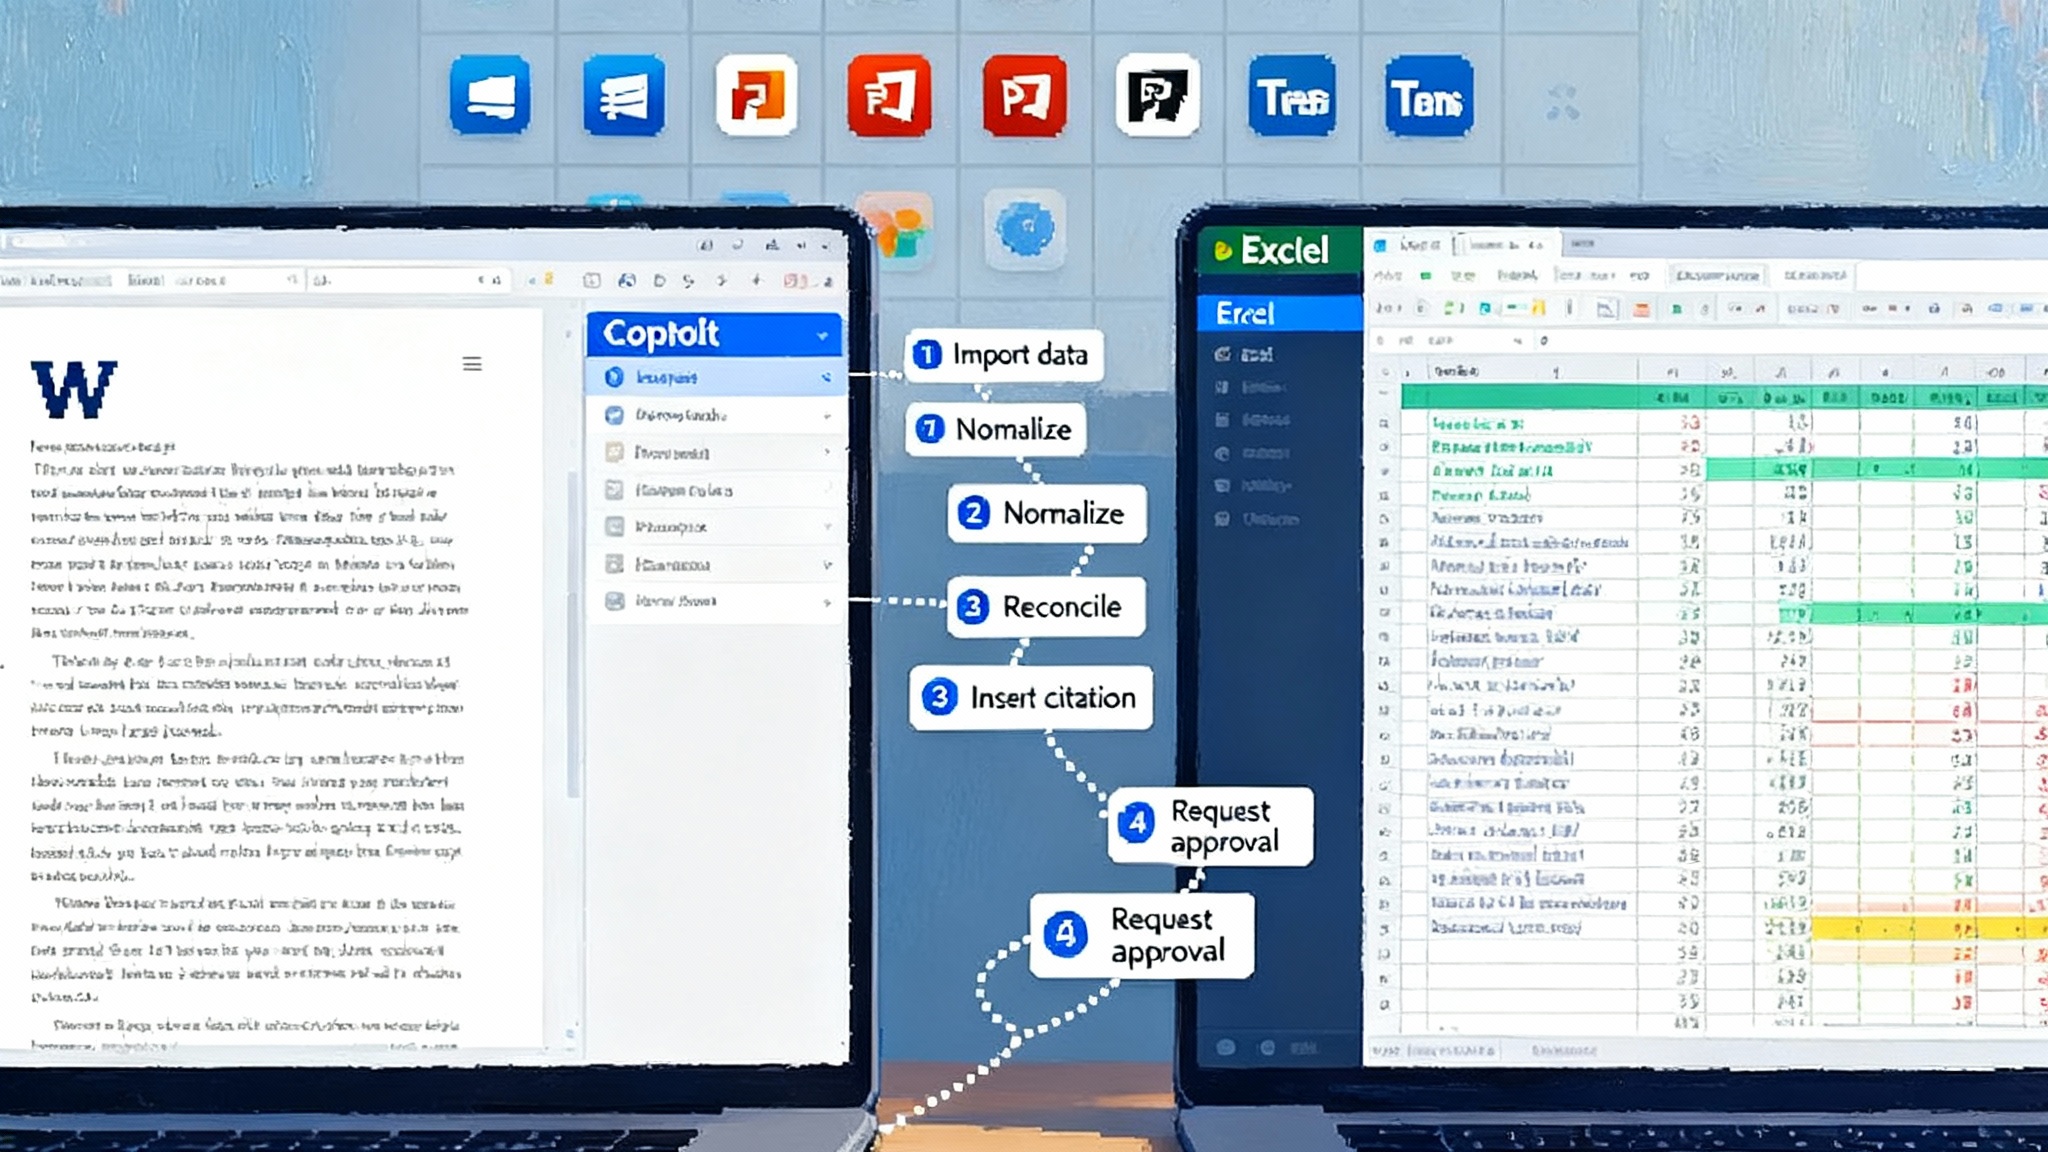
- Convert raw spans into consistent event types: plan, action, observation, handoff, human approval, cost update.
- Stitch events into coherent sessions so that a multi-agent handoff reads like one story.
3. Storage and query
- Durable, queryable stores for high-cardinality traces, inputs, outputs, and policy decisions.
- Cost-aware retention policies, redaction for sensitive text, and privacy controls for zero data retention environments.
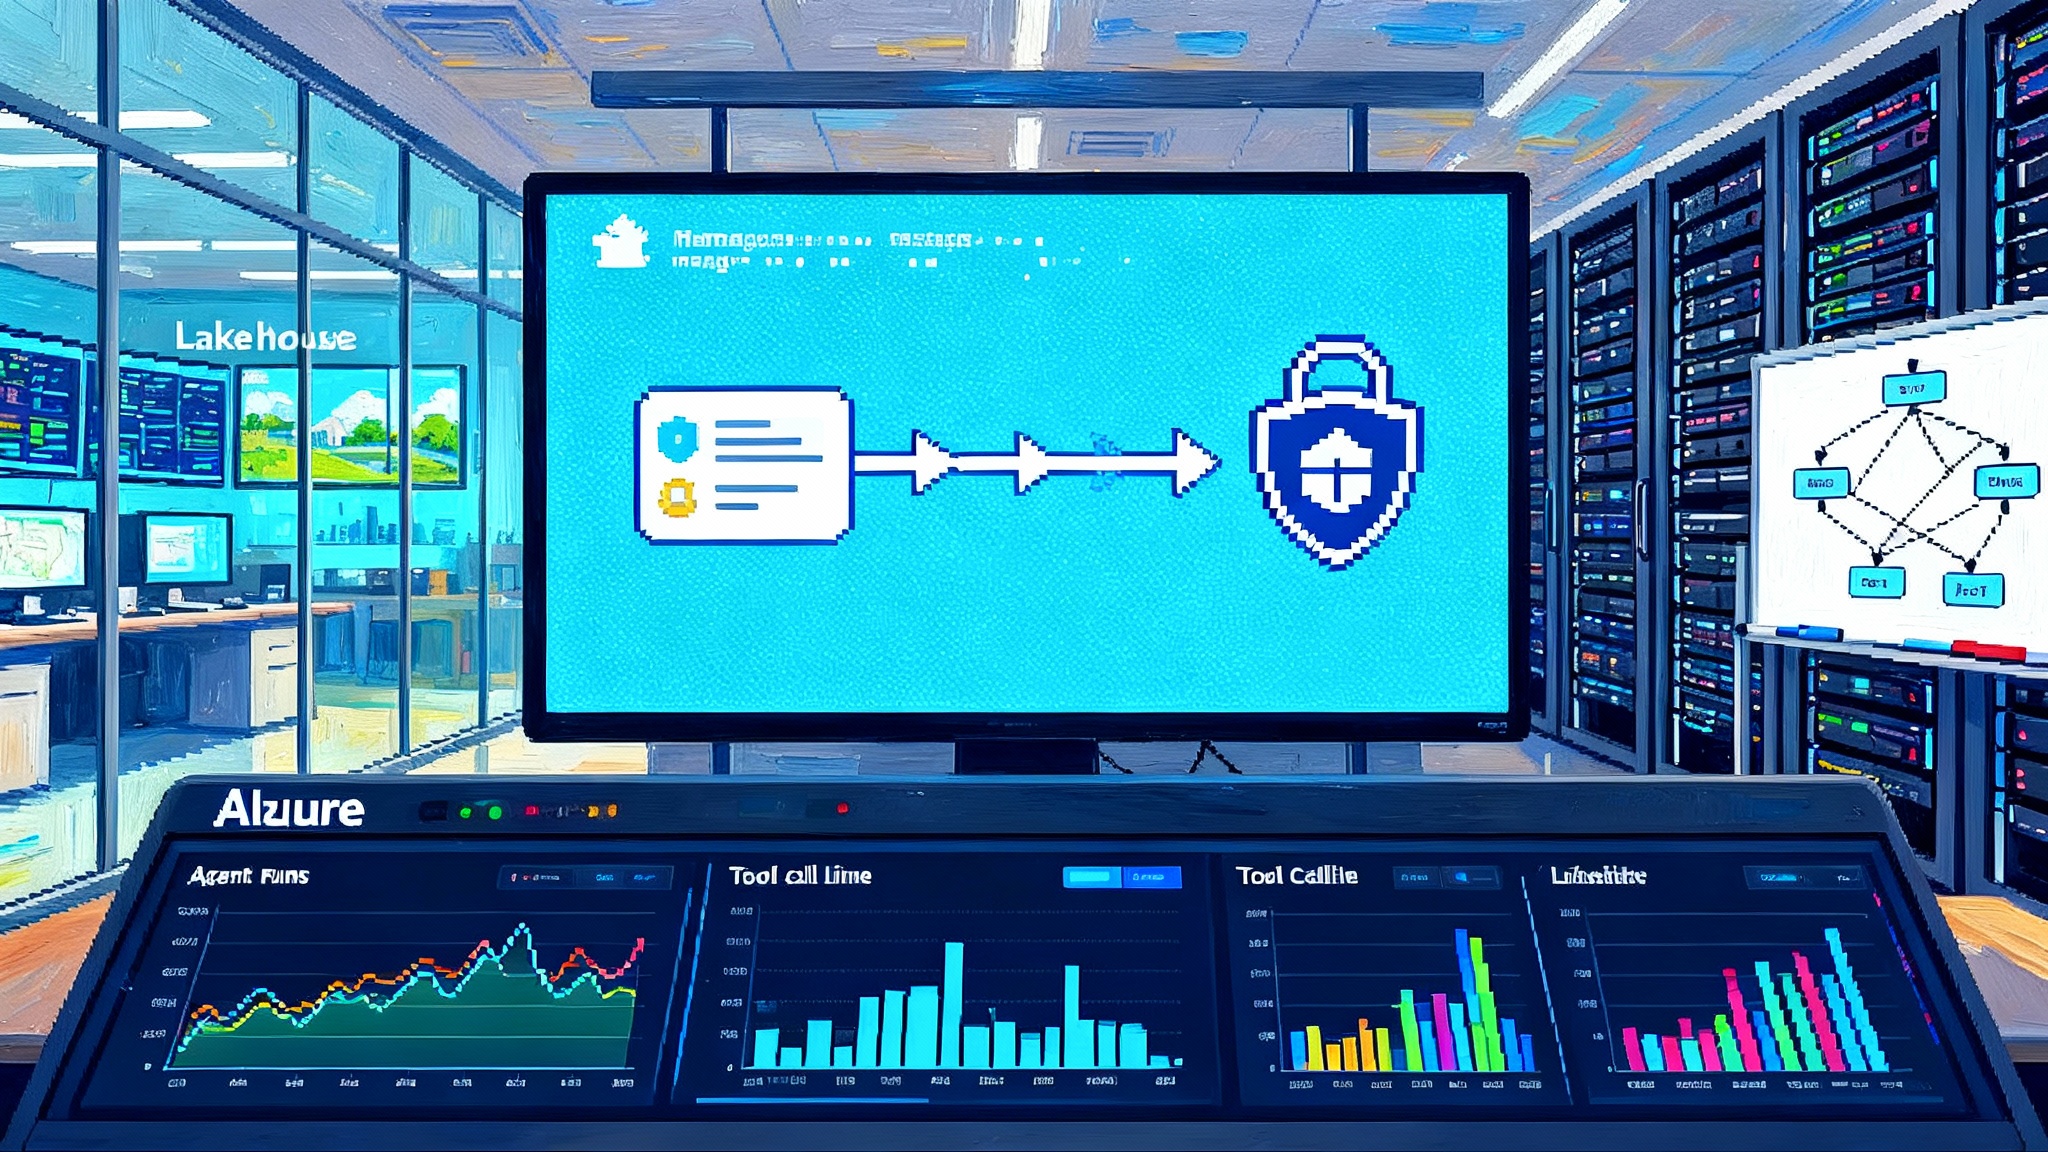
4. Dashboards and wallboards
- Real-time views that show adoption, task success, cost per successful outcome, time to escalation, common failure codes, top tool errors.
- Per-team wallboards in places like the contact center or claims operations.
5. Alerting and incident response
- Threshold and anomaly alerts on latency, error rates, hijack risk scores, and tool permission denials.
- Triage with replay and step-through debugging. Send alerts to Slack or Teams channels people actually monitor.
6. Evaluation and testing
- Offline evals for accuracy, safety, and robustness. Scenario replays with state injection and deterministic seeds.
- Canary deployments for new prompt chains, new tools, or new guardrails.
7. Policy and governance
- Tool allowlists, rate limits, and spend caps by environment. Human-in-the-loop checkpoints where legally required.
- Audit trails that tie every action to identity, policy version, and approval.
A practical note on interoperability: choose tools that speak both OpenTelemetry and Model Context Protocol. The former standardizes telemetry, the latter standardizes how agents connect to tools and data. This combination reduces bespoke glue code and makes migrations survivable. For the broader ecosystem shift, see the OSI common language for enterprise agents.
What just launched, and why it matters
- Salesforce shipped a Command Center that treats agents like operational services, not toys. It captures sessions, shows live health, feeds OpenTelemetry signals to popular monitoring stacks, and advertises built-in Model Context Protocol support. Enterprise buyers understand this shape, which is why Command Center slots into existing operations rhythms.
- LangSmith made OpenTelemetry ingestion and fan-out a first-class feature and published adapters that stream traces from the OpenAI Agents software development kit. That means the same traces that power your LangSmith dashboards can also feed your system-of-record observability tools.
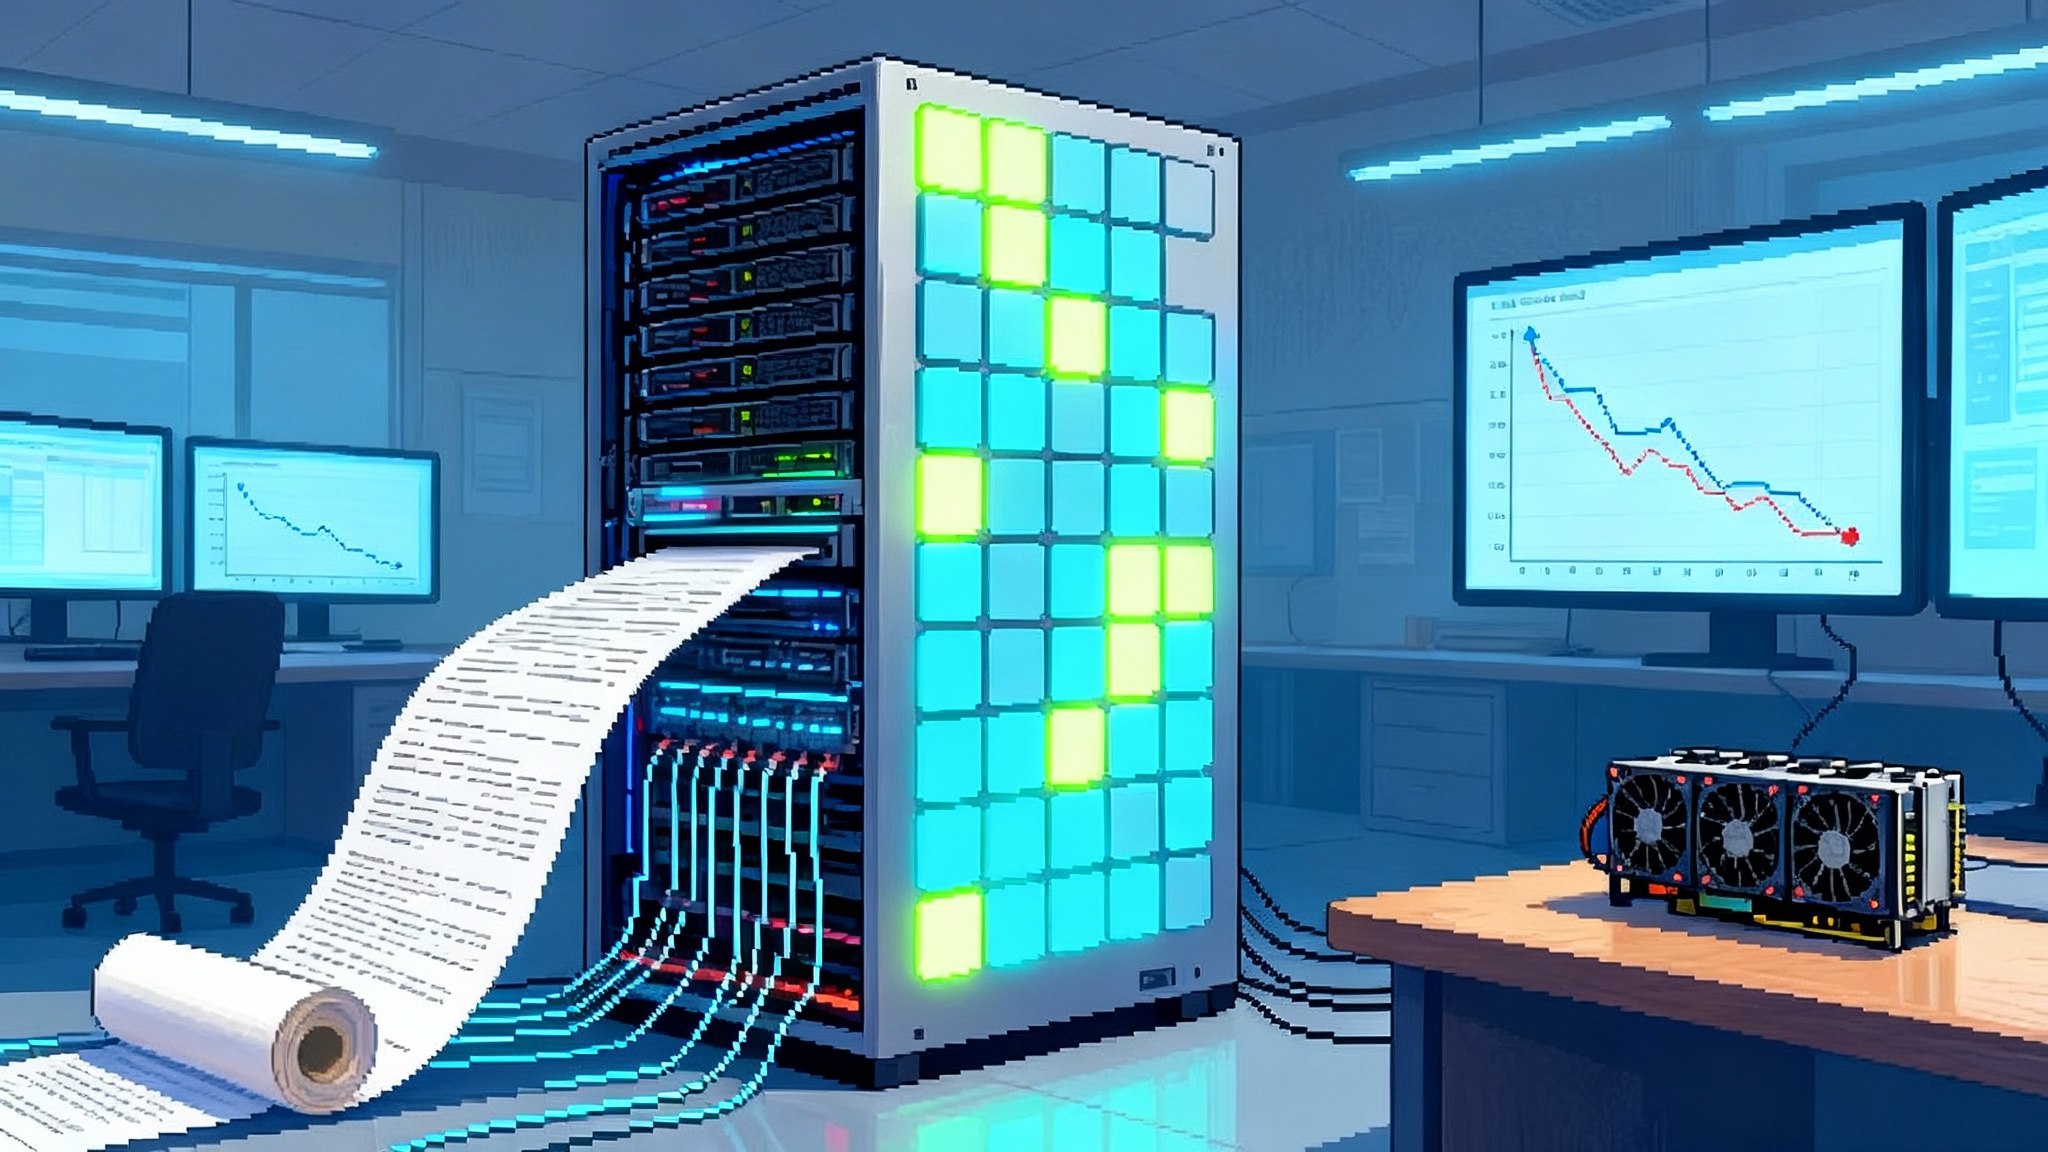
- The OpenAI Agents software development kit added built-in tracing and a traces dashboard, so even small teams can see what an agent did, with which prompt, and at what cost, before they wire up heavy monitoring.
These moves mirror how Azure Agent Ops goes GA, shifting focus from demos to governed workloads.
In short, observability is no longer a custom project. It is a product surface.
Security moved from slides to measurements
Agent hijacking is not hypothetical. In January the U.S. Artificial Intelligence Safety Institute released an analysis of agent hijacking and showed how new red team attacks dramatically increased success rates in common task environments, along with concrete risk scenarios like remote code execution and automated phishing in its AISI agent hijacking evaluations. That work matters because it gives security and compliance leaders something testable to aim at.
What to do with this, immediately:
- Separate plan from act. Generate plans without tool access, then execute against an allowlist. This blocks many indirect prompt injections that try to smuggle in new goals.
- Isolate environments. Treat tools and credentials like production systems, with per-agent and per-environment scopes. Do not let a staging agent touch live finance.
- Require explicit approvals for high-risk actions. Define thresholds for spend, data exfiltration, or external messaging that always trigger a human check.
- Monitor for suspicious loops. Alert when an agent repeats the same tool call, increases token use rapidly, or flips goals mid-run.
- Red team on repeat. Re-run known hijack scenarios whenever you change prompts, tools, or models. Measure attack success by scenario, not just in aggregate.
Measuring what matters, not what is convenient
Traditional model dashboards excel at token counts and latency. Agent observability adds business outcomes and failure modes. Adopt these metrics:
- Task success rate: percent of runs that achieve the user objective without human takeover.
- Escalation rate and time to escalation: how often and how quickly a human intervenes.
- Cost per successful task: a blended figure that includes model calls, tool usage, and human time.
- Mean time to detect a bad path: how fast your alerts surface a risky or unproductive plan.
- Hijack risk score and incident count: scenario-specific, tied to controls.
- Regressions caught by canaries: a measure of your ability to ship changes safely.
Put these on a wallboard next to classic service metrics. When leaders can see cost per successful task trending down while safety incidents trend flat, budgets follow.
Adoption playbooks that work
Here is a concrete, quarters-long plan drawn from teams shipping agents in production.
Phase 1, two to four weeks
- Instrument everything with OpenTelemetry or your vendor’s tracing by default. Turn on tracing in the OpenAI Agents software development kit. Add LangSmith or a similar system so non-engineers can read traces.
- Define five core events: plan, tool call, observation, escalation, finish. Normalize names across agents.
- Add basic wallboards for success rate, cost, latency, and top failures. Send alerts to a shared incident channel.
Phase 2, next six to eight weeks
- Wire policy at the tool boundary. Start with allowlists, soft rate limits, and spend caps by environment.
- Introduce canaries for prompt and tool changes. Require a canary to beat baseline by a margin before rollout.
- Stand up hijack scenarios that mirror your workflows. Run them as nightly evals and publish results.
Phase 3, the following quarter
- Push traces to your company observability stack so Site Reliability Engineering can help. Add synthetic tests for critical paths.
- Create per-team wallboards in operations. Supervisors should see agent health alongside human metrics.
- Tie observability to money. Track cost per successful task, then budget for tools and headcount based on trend lines.
Interoperability beats lock-in
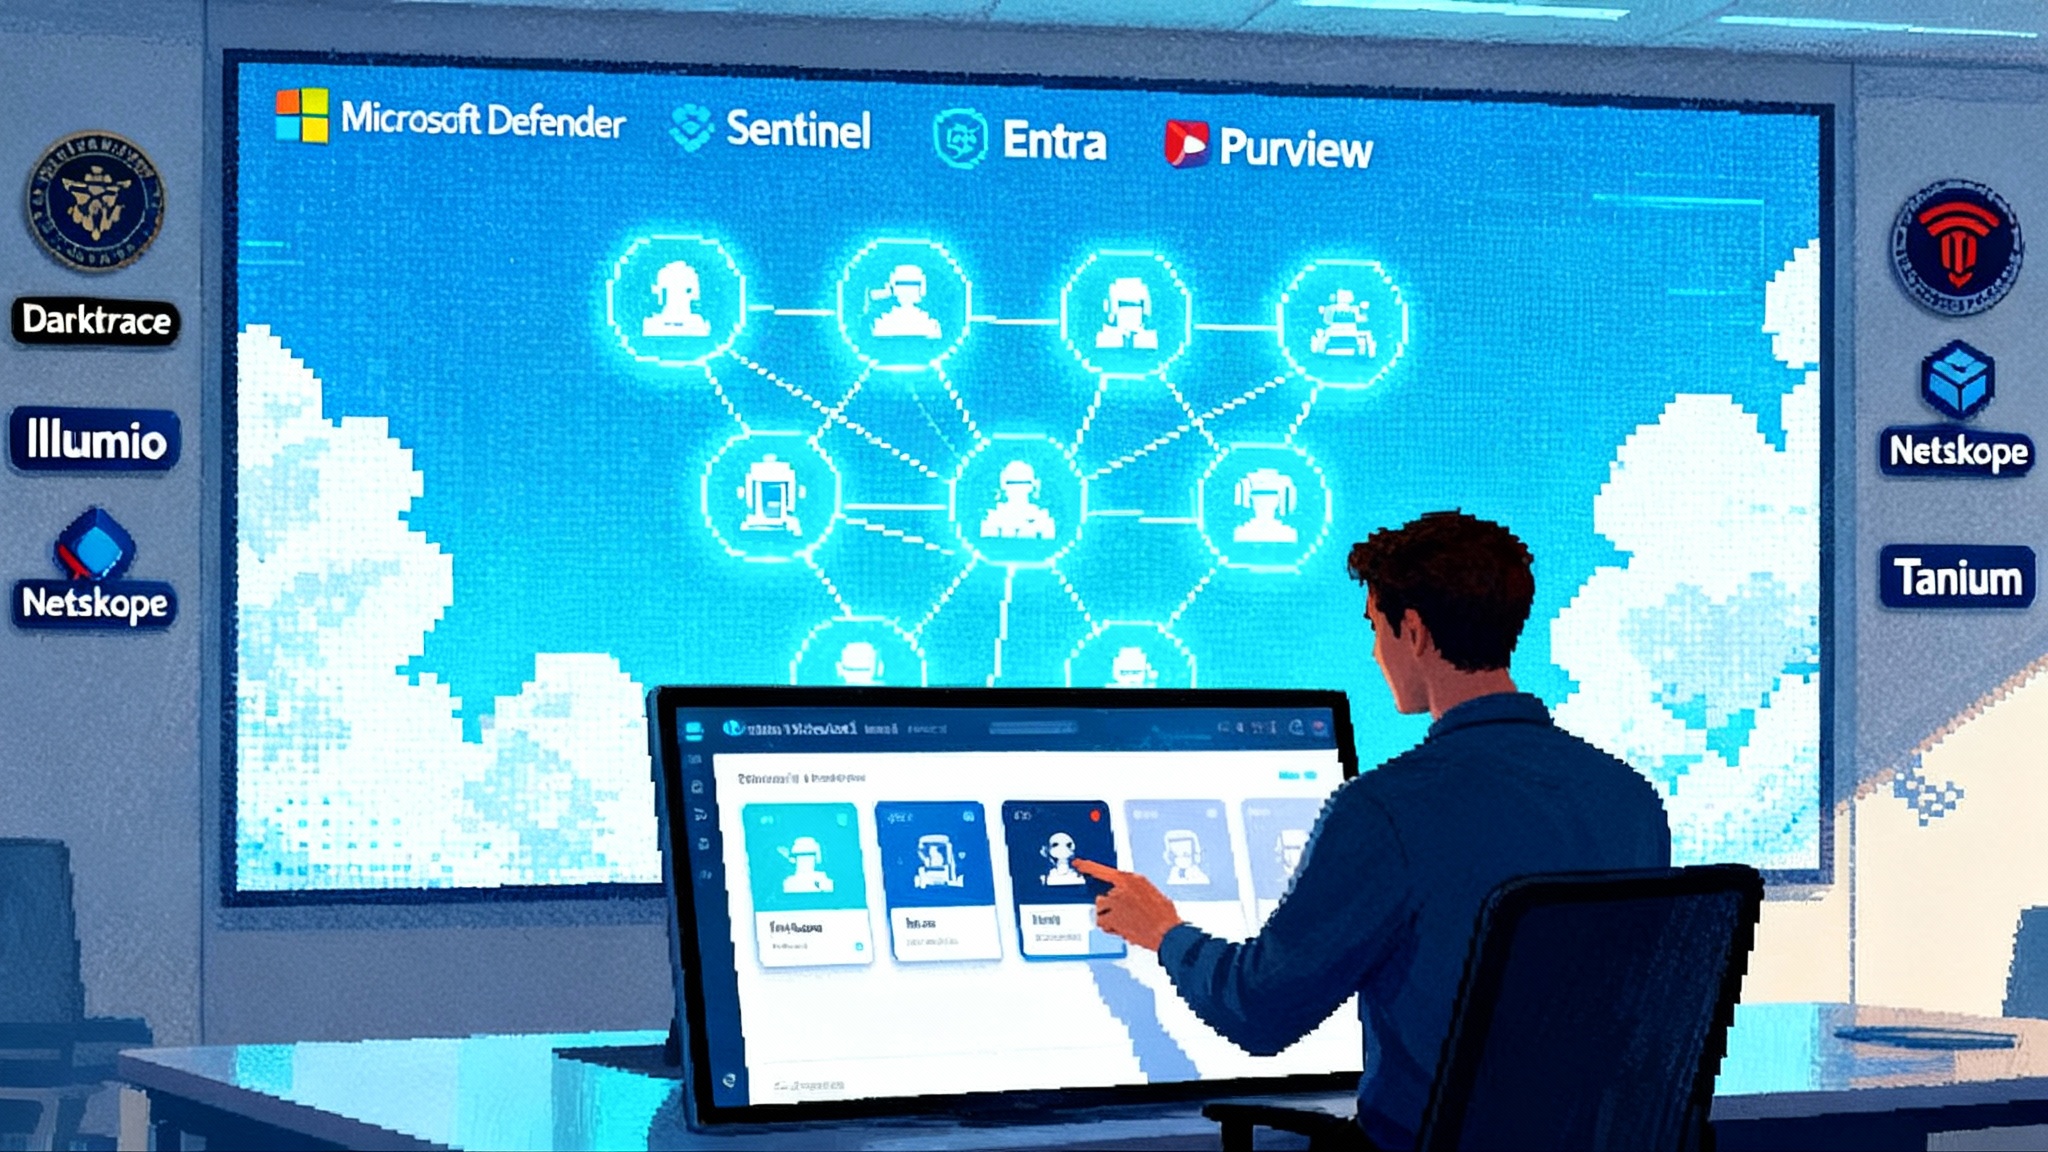
Model Context Protocol and OpenTelemetry do for agents what standard connectors and metrics did for cloud native systems. They make the ecosystem composable. With Model Context Protocol, an agent can discover and use tools in a consistent way, whether that tool lives in Windows, a data platform, or a vertical application. With OpenTelemetry, you can send the same traces to your choice of analysis tools.
The practical win is optionality. If a vendor changes pricing or a model degrades, you can swap components without losing your audit trail or your dashboards. That is the difference between a toy and an operating system.
Build, buy, or blend
- Buy the platform when you are standardizing across many business units. Think Command Center style products that ship dashboards, policy controls, and integrations on day one. You will trade some flexibility for speed and governance.
- Build with a toolkit when you have strong engineering and unique workflows. Combine the OpenAI Agents software development kit, LangSmith tracing, and your existing observability stack. You will own more of the plumbing, and you can tune it to your domain.
- Blend when you want the best of both. Run a platform for core use cases, then layer custom agents for edge cases. Keep everything in one telemetry fabric so you can compare apples to apples.
ROI through 2026, in plain numbers
A credible return on investment case connects observability to outcomes, not to dashboards.
- Contact centers: if agents resolve 20 percent of tickets end to end, and tracing plus evals let you raise that to 35 percent while holding satisfaction steady, the labor savings often fund the program alone. Observability gives you the defect taxonomy to get there.
- Sales operations: instrumented proposal agents expose where they stall, for example during data fetch or pricing approval. Fix the top two stalls and you often cut cycle time by days, which translates to higher conversion.
- Back office: finance and supply chain agents benefit from clear permissioning. Observability shows where approvals are missing or tools return inconsistent schemas. Fix those, and you eliminate rework.
The secondary gains are real. Faster iteration because you can see what to change. Lower risk because you catch bad paths early. Better vendor leverage because your telemetry is portable.
Monday morning actions
- Turn on tracing everywhere. If it moves, trace it.
- Define your top three business metrics for agents. Put them on a wallboard this week.
- Pick two hijack scenarios that reflect your workflows. Add them to your nightly evals.
- List every tool your agents can call, then add explicit allowlists and rate limits.
- Decide which interoperability path you will standardize on for telemetry and tools. Document the choice.
The take-home comparison
Traditional model-centric approaches chase benchmark gains that may or may not survive contact with real workflows. A control-plane approach accepts that agents are systems. It gives you the visibility to debug, the levers to govern, and the standards to avoid lock-in. It is not as flashy as a model reveal, but it is how transformation projects cross the production gap.
Closing thought
Agents will not become valuable because they sound clever. They will become valuable because they can be directed, measured, and improved. That is what a control plane is for. The companies that treat observability as the product, not an afterthought, will compound wins quarter after quarter. In 2026 the competitive gap will not be who has the largest model. It will be who has the clearest picture and the firmest hand on the controls.


