2026 Is the VPP Breakout: FERC 2222 Clears the Runway
FERC Order 2222 has cleared the path for distributed energy fleets to compete like power plants. With devices in place and markets opening, 2026 to 2028 will be the first real test of VPP scale, speed, and reliability.
The ruling that unlocked a new kind of power plant
In September 2025, the Federal Energy Regulatory Commission clarified and affirmed the frameworks that let distributed energy resource aggregations participate in wholesale markets, notably in California and New York. The throughline is FERC Order No. 2222 explainer, which directs regional grid operators to remove barriers so aggregations of small devices can bid alongside big power plants. Put simply, the door is open and the path is marked.
If Order 2222 is the runway, then 2026 is the takeoff. You can turn software and existing devices into a virtual power plant far faster than you can pour concrete for a new turbine. After the 2025 summer of pilots and partnerships, the participants are ready.
What a virtual power plant really is
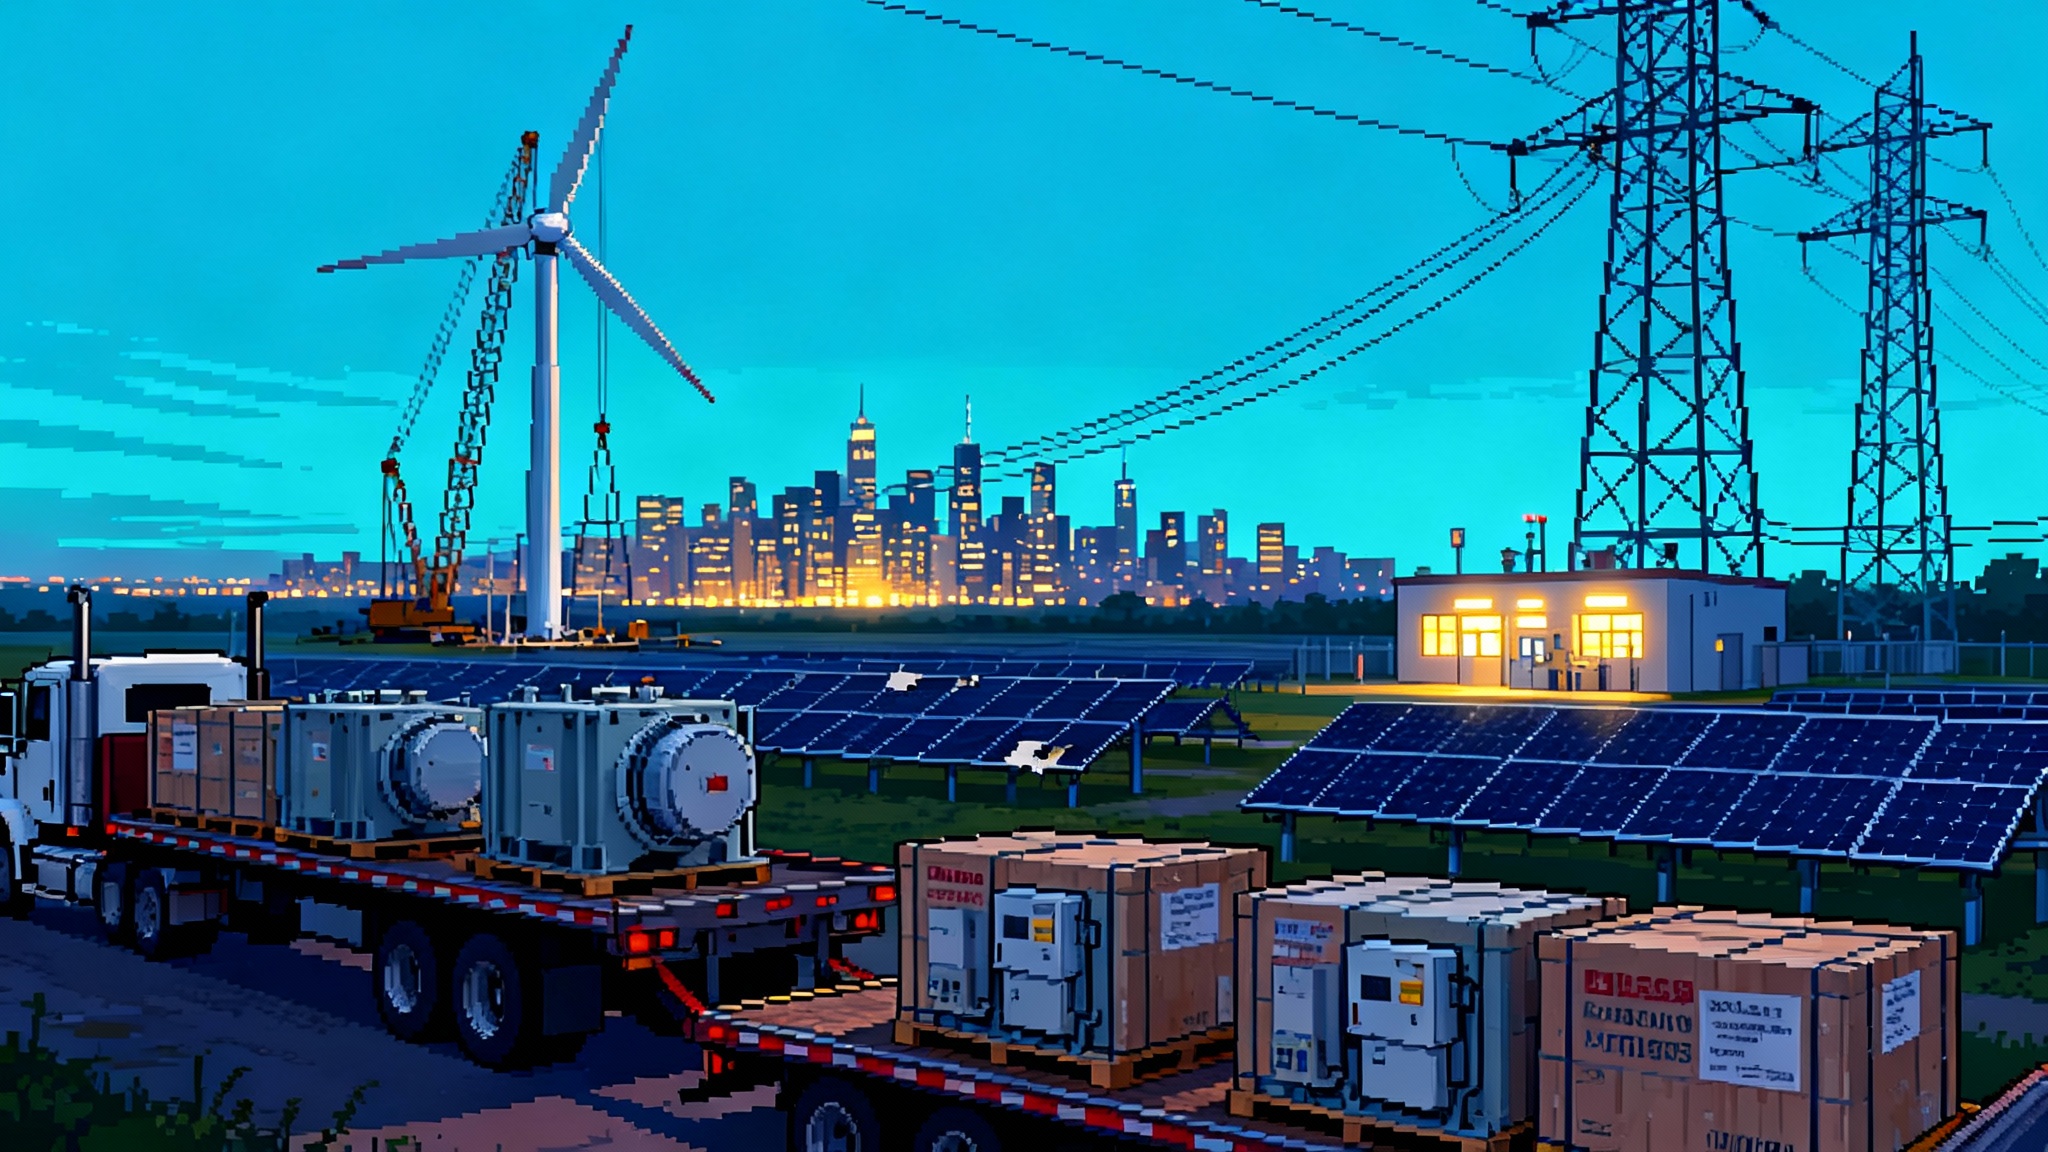
A virtual power plant, or VPP, is a fleet of small, controllable devices that move together like a school of fish. Each device is tiny compared with a power plant, but when thousands respond in concert, the effect looks like generation to the grid operator. These fleets include home batteries, electric vehicles, smart thermostats, commercial building controls, water heaters, and industrial loads that can coast for minutes without affecting output.
A useful metaphor: think of the grid as a highway. Traditional power plants are the big trucks that carry most of the freight. A VPP is the system that syncs all the cars’ cruise control. When traffic starts to slow, the system tells some cars to ease off and others to speed up. No new lanes required, just coordination.
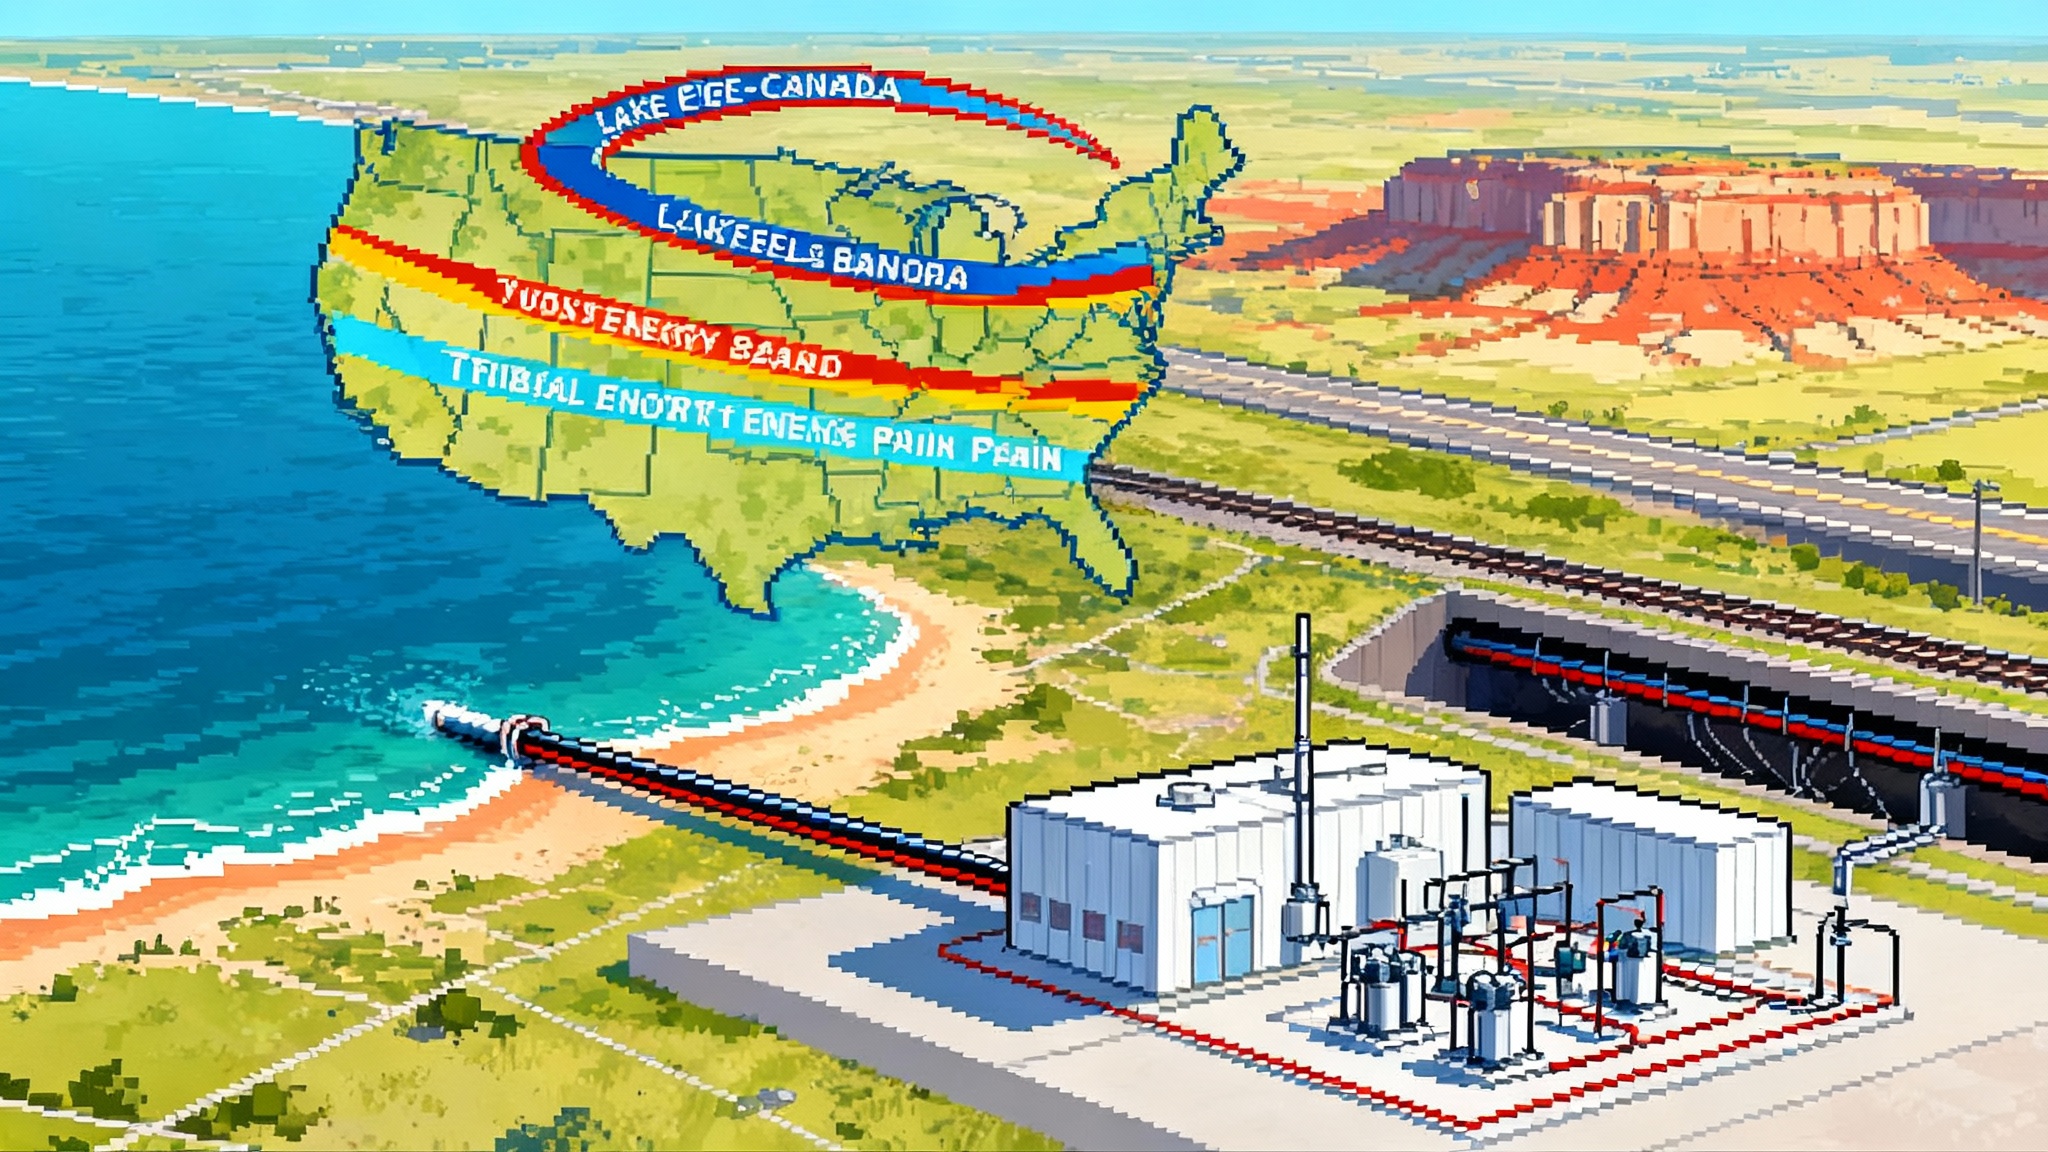
For grid planners weighing long‑distance solutions, see how NIETC corridors go prime time while VPPs deliver near‑term flexibility from devices already in garages, basements, and factory floors.
Why 2026 to 2028 is different
Two factors change the trajectory.
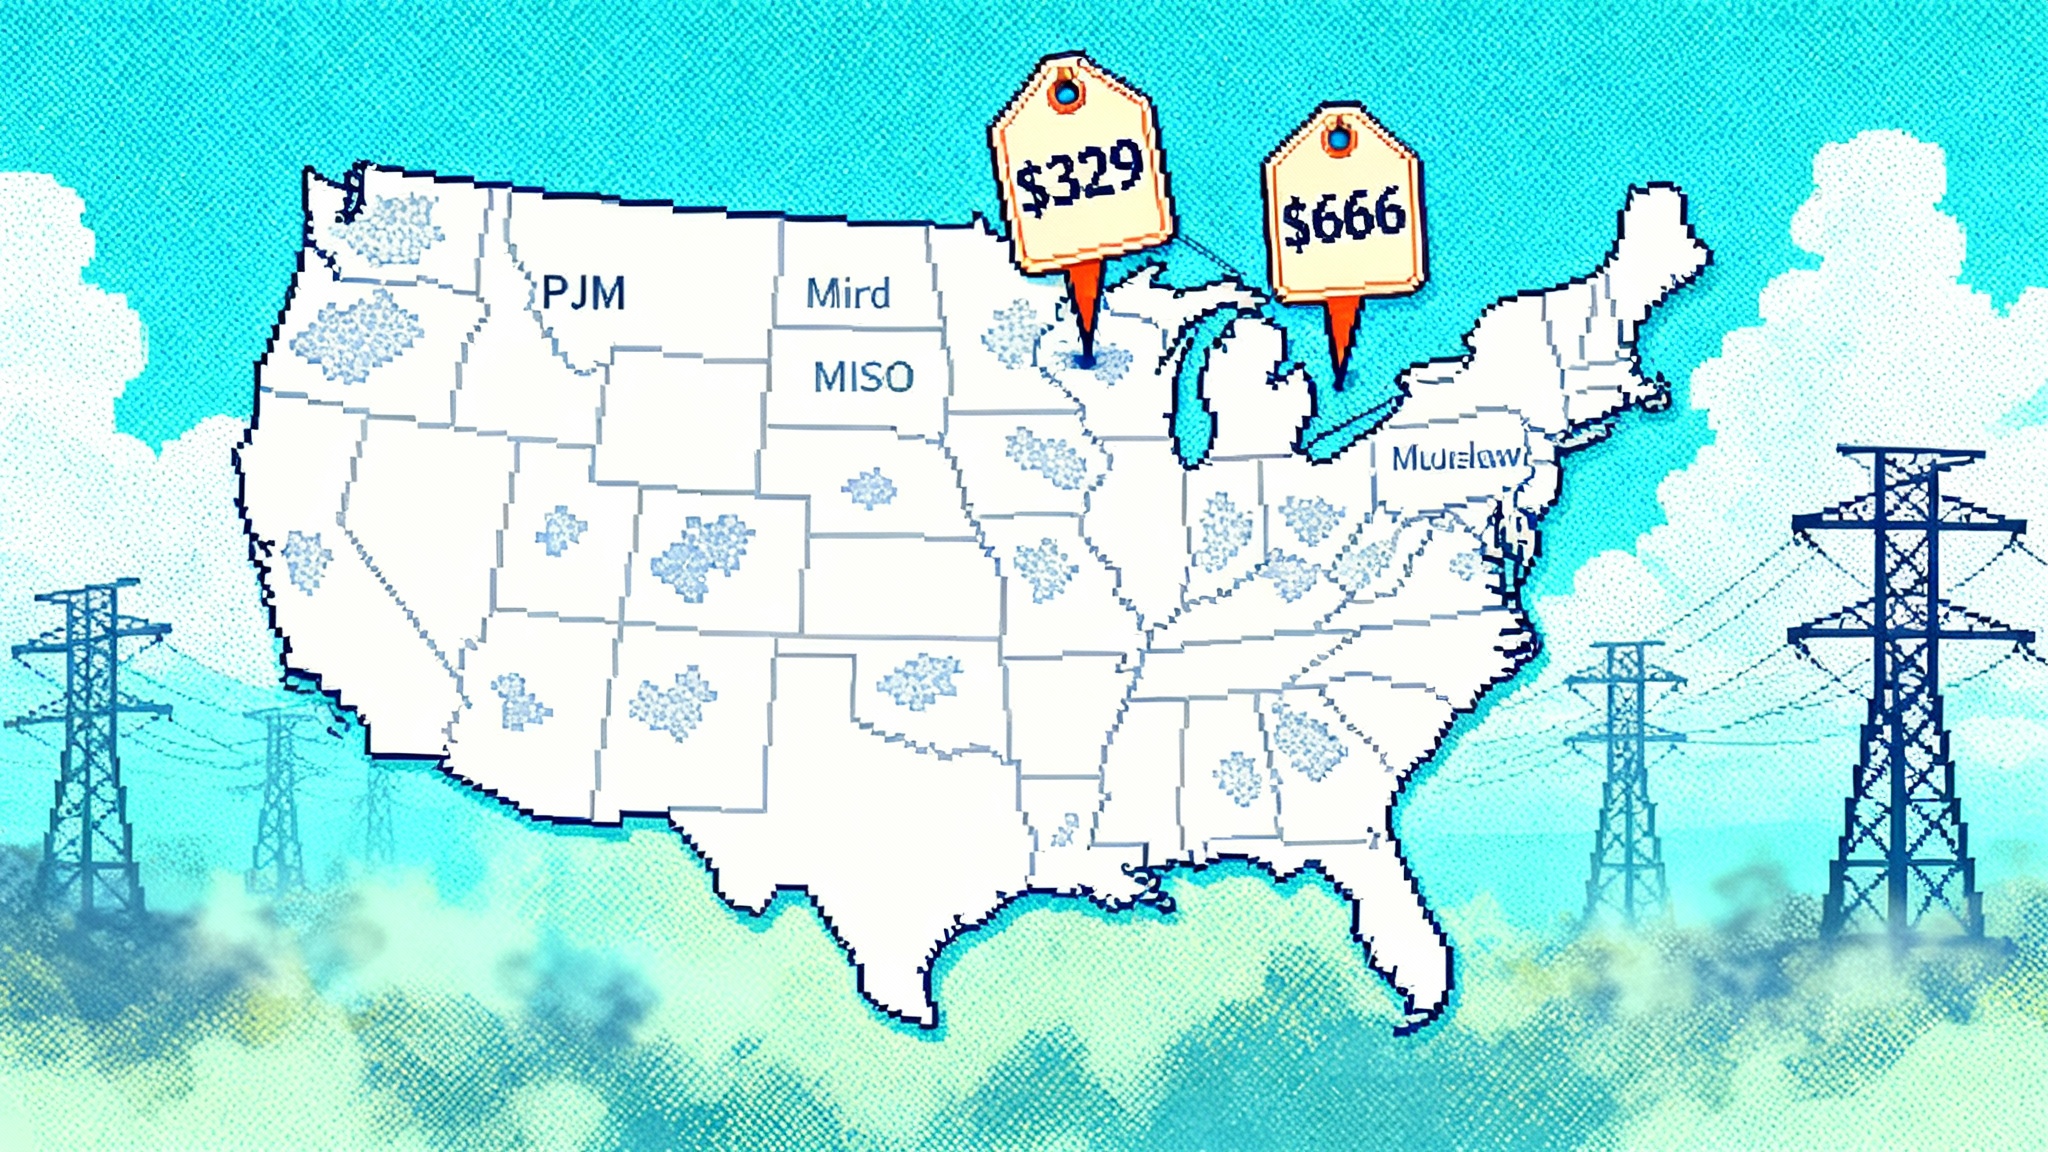
- Market access. Order 2222 implementation schedules across the regional markets line up with summer reliability needs between 2026 and 2028. New York targets full participation by the end of 2026. ISO New England aims for late 2026 in energy and ancillary services, with capacity market pathways aligning with its 2026 auctions for the 2028 to 2029 delivery year. MISO moves in two phases through 2027 and 2029. PJM opens capacity market access for 2027 delivery and energy services in early 2028. SPP points to 2030. California’s path is already open through its aggregation models, with refinements underway. Recent PJM and MISO capacity prices underscore why near‑term, fast‑start capacity matters.
- Scale. The installed base of batteries, controllable loads, and connected vehicles is now large enough that even modest participation rates produce hundreds of megawatts on short notice.
On scale, consider what the largest aggregators already marshal: several gigawatts of flexible demand response under management across North America. Meanwhile, the residential side is proving it can deliver real peaks. Sunrun reported nearly 80 megawatts of instantaneous peak from its programs across 2024, as shown in Sunrun’s 2024 program results. These are not science projects. They are commercial offers that can be stood up quickly.
Texas is a bellwether for how quickly customer devices move into wholesale operations. Multiple active VPPs in ERCOT’s aggregated DER pilots compensate devices to be available and to discharge during system needs. For context on the state’s trajectory, see Texas batteries overtake California.
Fast, firmable capacity without new steel
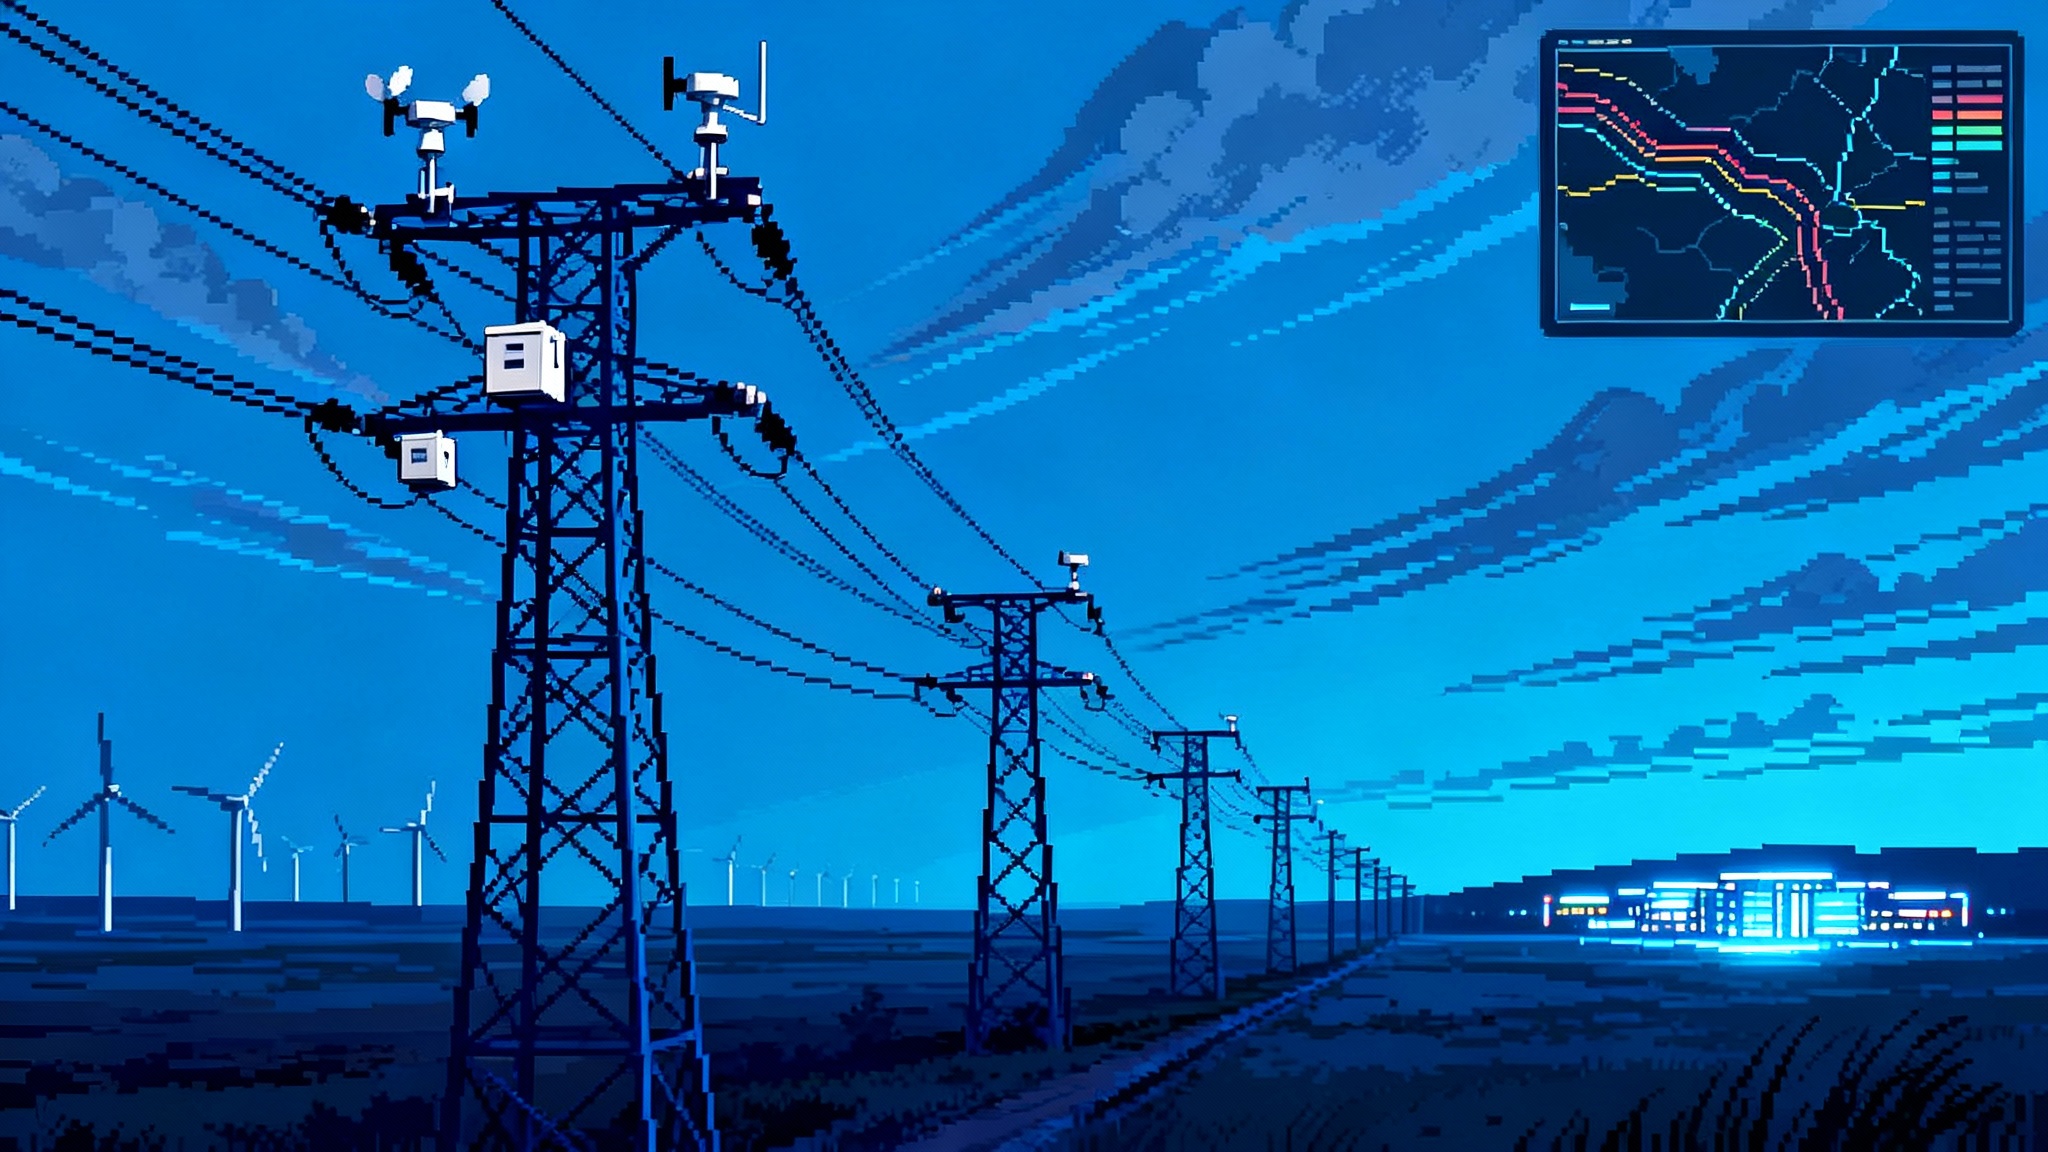
What system planners need for summers 2026 to 2028 is capacity that shows up when the thermometer spikes. VPPs deliver that in three ways.
- Shifting. Smart thermostats pre‑cool buildings so air conditioners run less in the tightest hours. Water heaters and ice storage shift electric use out of peak.
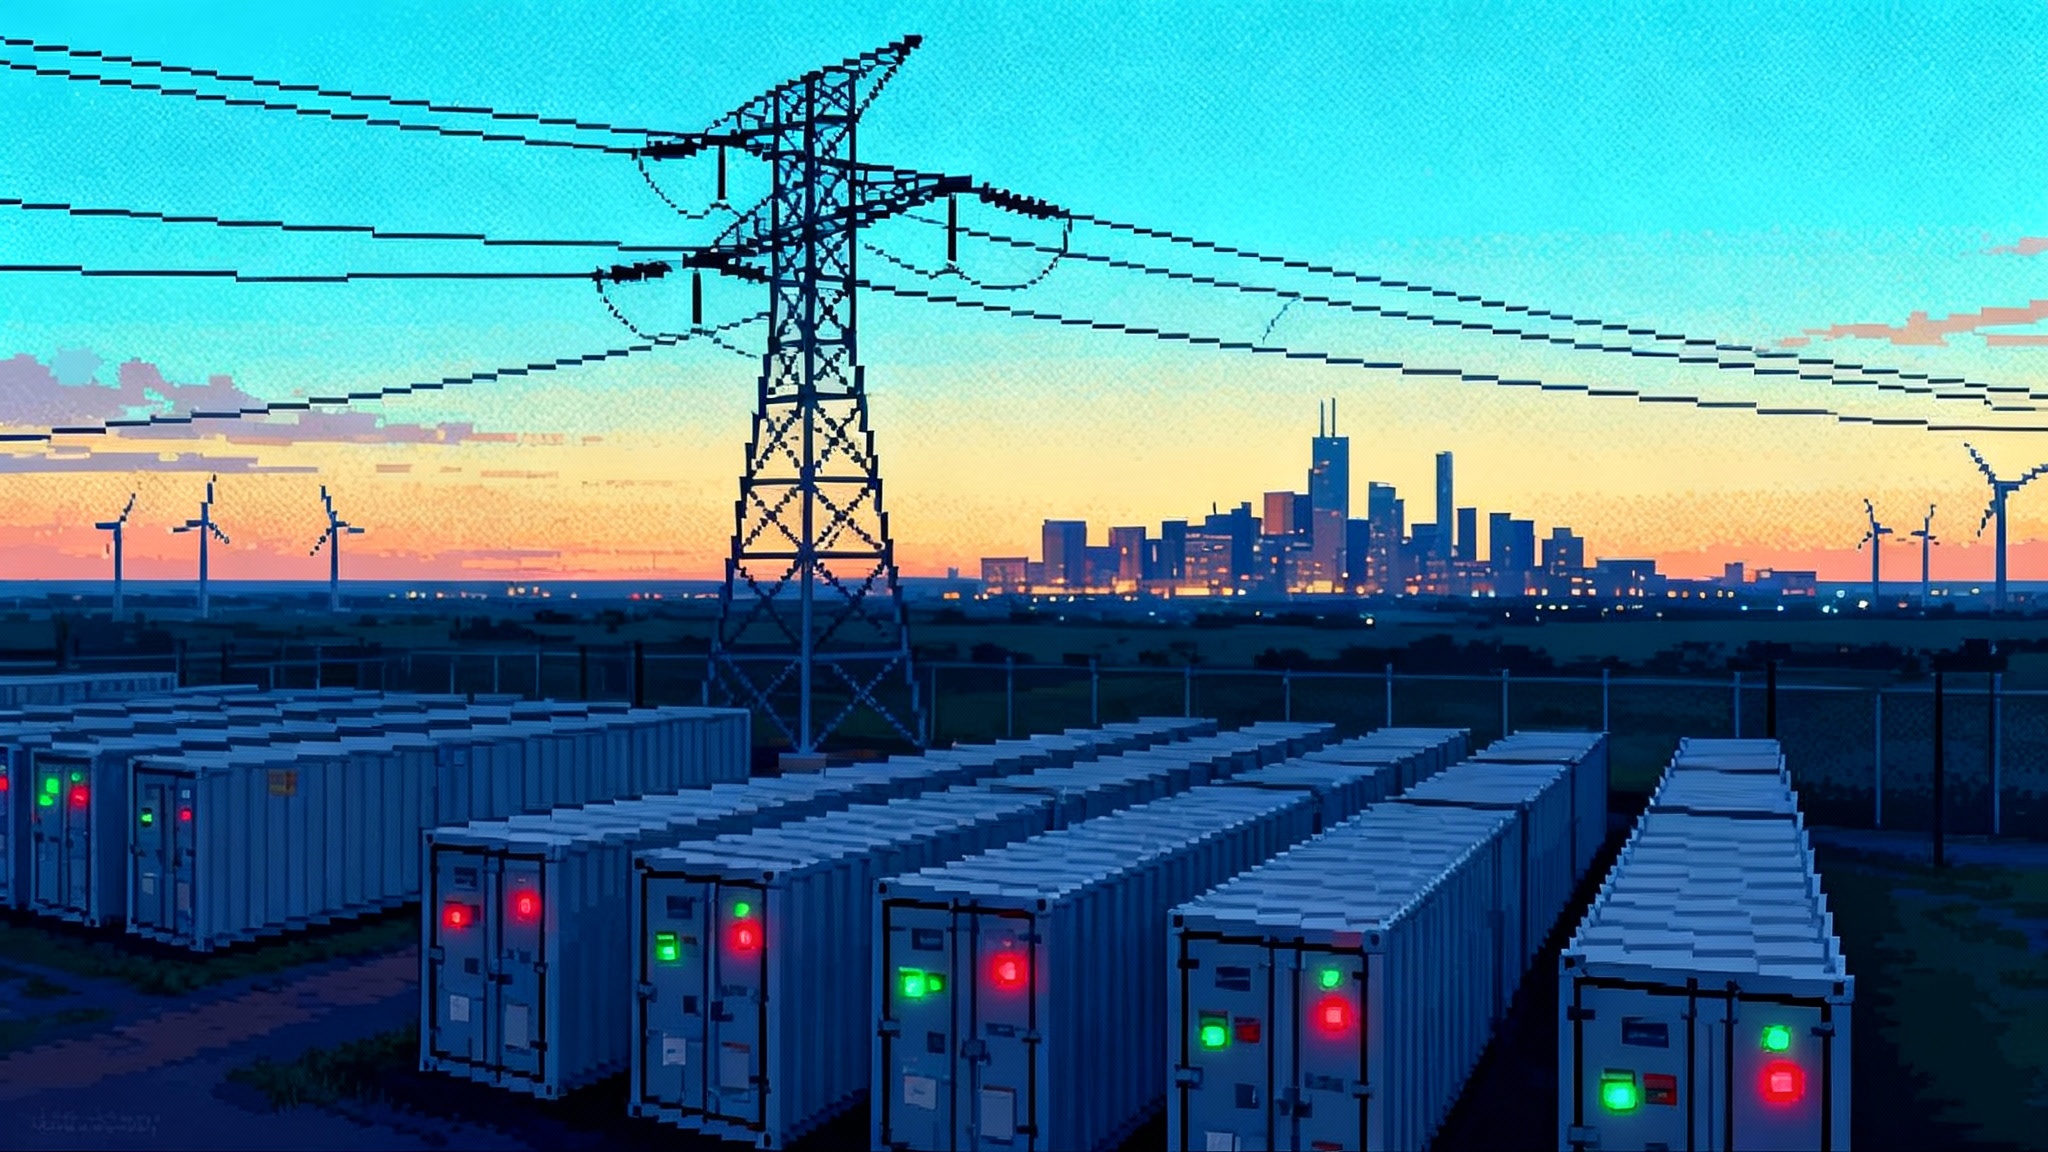
- Discharging. Home and commercial batteries export stored energy during tight hours. Many can cover three to five hours of peak, which is often the margin that averts rotating outages.
- Curtailing. Industrial and large commercial sites trim loads for short windows. The best programs tune curtailment to operations so there is little or no loss of output.
The key word is firmable. A single thermostat is not firm, but ten thousand thermostats with telemetry and a performance guarantee are. Modern VPP contracts pay for availability, require telemetry and measurement, and are backed by aggregators that over‑procure a cushion to hit dispatch targets. The aggregator’s job is to turn variable participation at the device level into predictable performance at the portfolio level.
Revenue stacking, explained in plain English
VPPs earn money in three main ways, and the order matters.
-
Capacity. This is the readiness payment. Markets pay resources to be there on the worst days. Think of it as a retainer. A VPP offers a specific number of megawatts for a set number of hours on defined days. If called and it performs, it keeps the retainer. If not, it pays penalties. For a battery‑heavy VPP, capacity value is the core.
-
Ancillary services. These are the grid’s control surfaces, like rudders and flaps. Frequency regulation and reserves pay resources that can respond in seconds to minutes. Batteries and certain smart loads excel here. In many markets, ancillary services are more lucrative than energy sales on normal days.
-
Energy and peak pricing. This is selling or avoiding kilowatt‑hours when prices spike. During tight conditions, prices can jump by orders of magnitude for short windows. A VPP can discharge batteries or lower load to avoid those prices, capture the spread, and pass a share to customers.
A simple example shows the stacking. Imagine a 100 megawatt VPP composed of 80 megawatts of batteries and 20 megawatts of controllable load. It wins a capacity contract for five summer hours across ten peak days. That retainer covers the fixed cost of customer incentives and operations. On top, it enrolls a 20 megawatt slice in frequency regulation, earning a steady ancillary revenue stream on most days. Finally, when extreme heat drives hourly prices to their cap, the VPP shifts from regulation to energy for the peak hours and collects scarcity rents. The point is not to guess precise dollars. It is to show that a well‑designed portfolio can turn three modest revenue streams into a healthy total while still sharing value back with participating homes and businesses.
The capex‑light playbook utilities can run now
You do not need a procurement cycle measured in years to stand up meaningful capacity. Here is a practical playbook that utilities, competitive retailers, and fleet owners can start this quarter.
- Build a single enrollment funnel. If you ask customers to sign six forms for six programs, you will lose them. One digital consent that covers managed charging, thermostat control, and battery participation is faster, easier, and compliant.
- Lead with batteries and managed charging. Batteries deliver the most precise dispatch. Electric vehicle charging gives the largest flexible load. Make those your anchor offers. Add thermostats and water heaters as low‑friction add‑ons.
- Use an availability payment plus performance bonus. Customers commit capacity. You pay a monthly availability credit, then share upside based on actual performance during events. This matches what leading aggregators and retailers already do in Texas and California.
- Pre‑qualify devices and vendors. Publish an approved device list and a software telemetry standard. Let aggregators plug into one utility application programming interface rather than many.
- Align retail rates with dispatch. If you are a retailer, VPPs work better with rates that make peak hours visible. Even simple peak windows, like 6 to 9 p.m., steer behavior in the right direction.
- Coordinate distribution reviews once, not case by case. Replace site‑by‑site reviews with feeder‑level guardrails, portfolio caps where needed, and automated approvals for typical residential installs.
ISO‑by‑ISO: who goes live when, and what to expect
These dates and ranges reflect current implementation guidance. They can move, and local tariffs fill in details, but they are sufficient for near‑term planning.
- CAISO, California Independent System Operator. Aggregation pathways exist today through CAISO’s models and demand response structures. Expect incremental upgrades rather than a single big‑bang date. Near‑term opportunity: hundreds of megawatts through 2026, driven by residential batteries and commercial building controls.
- NYISO, New York Independent System Operator. Targeting full Order 2222 implementation by end of 2026. Near‑term opportunity: 200 to 500 megawatts by summer 2027, anchored by batteries in downstate zones and commercial demand response.
- ISO‑NE, ISO New England. Energy and ancillary services implementation aimed at November 2026, with capacity market pathways tied to auctions in 2026 for the 2028 to 2029 delivery year. Expect initial portfolios in the 200 to 400 megawatt range by 2027, with growth as metering and verification standardize.
- PJM. Capacity market access February 2027, energy and ancillary services by February 2028. Given PJM’s size and the depth of existing demand response, first‑wave VPPs could surpass 500 megawatts by 2028, with multi‑gigawatt potential as EV managed charging scales.
- MISO. Two phases, June 2027 and June 2029. Expect utility‑led enrollment in the Upper Midwest to start with commercial and industrial controls, then add residential batteries as adoption grows. First‑phase portfolio sizes in the 200 to 500 megawatt range are realistic.
- SPP. Second quarter 2030. Treat this as a planning horizon rather than a 2026 to 2028 capacity source, aside from state or utility pilots that run outside the market.
These ranges are conservative. They reflect what can be contracted and telemetered quickly, not the full technical potential.
Policy risks you can see coming
- Heterogeneous aggregations providing all services. New York’s proceedings highlight the complexity of letting mixed device fleets provide every ancillary service they are technically capable of. Translation for planners: do not bet a portfolio on a service until the tariff language and telemetry requirements are final.
- Double compensation guardrails. California’s pathway makes clear that resources cannot be paid twice for the same service across retail and wholesale programs. Aggregators need clean accounting and clear priority rules for dispatch.
- Measurement and verification. ISO New England debates have centered on accurate baselines and avoiding overpayment. Expect rigorous data standards, which support reliability but require upfront investment in telemetry and testing.
- Distribution utility review process. Order 2222 requires coordination so that wholesale dispatch does not create local problems. The practical risk is delay if reviews happen site by site. The mitigation is portfolio‑level screening and feeder caps where justified.
A realistic near‑term megawatt map
If you are a system planner or retailer thinking about summer 2026 to 2028, here is a pragmatic way to translate devices into capacity without overpromising.
- Residential batteries. Assume 2 to 3 kilowatts of reliable export per enrolled system across three to four hours, net of customer backup needs. With 50,000 enrolled batteries, you have 100 to 150 megawatts of firmable capacity.
- Managed EV charging. Assume 1 to 2 kilowatts per vehicle during peak windows, but count only vehicles routinely parked and connected in those hours. With 100,000 vehicles, that is 100 to 200 megawatts of flexible load reduction.
- Smart thermostats and water heaters. Count 0.3 to 0.5 kilowatts per device for two to three hours with good pre‑cool and pre‑heat strategies. At a million devices, that is 300 to 500 megawatts.
- Commercial and industrial controls. Portfolios in the tens to hundreds of megawatts are achievable in months when incentives match production schedules.
Add these together and it becomes clear why VPPs are attractive in 2026. Even modest participation rates deliver hundreds of megawatts that can be contracted, tested, and ready before the first heat wave.
What each player should do next
- Utilities. Publish a single VPP tariff rider that pays for availability and performance across batteries, EVs, and smart loads. Pre‑approve devices and publish telemetry specs. Use competitive solicitations to select aggregators, but allow multiple winners to speed enrollment.
- Competitive retailers. Pair a flat or time‑of‑use plan with a storage credit and a sellback rate that encourages export in peak hours. Bundle enrollment into your retail contract so grid services are not an afterthought.
- Fleet owners. Start with depot charging. Managed charging and on‑site batteries can commit a slice of capacity without stranding operations. For workplace fleets, managed charging windows often align with grid peaks.
- Aggregators. Over‑procure by 10 to 20 percent to guarantee delivery. Invest early in telemetry and baseline validation. Focus first on capacity and ancillary services where rules are clear, then add energy arbitrage as a bonus.
The bottom line
The market finally has rules, devices, and demand at the same time. Order 2222 makes it possible for small devices to earn big‑plant revenue, and the 2025 wave of programs shows the business models are ready. For planners confronting hot summers before new steel can be financed, virtual power plants provide a capex‑light bridge to reliability. The next two years will determine who built enrollment pipelines and who waited. In 2026, speed, software, and customer trust will behave like a power plant of their own.