45V Is Final: Hydrogen’s 2025 Reset and What Gets Built
Treasury and IRS finalized the 45V hydrogen tax credit on January 10, 2025. Here’s how hourly matching, deliverability, and carbon thresholds will shape green vs blue economics and 2026–2028 FIDs.
The new ground rules in one page
The clean hydrogen market finally has a rulebook. Treasury and IRS published the final 45V regulations on January 10, 2025, setting definitive requirements for carbon intensity accounting and electricity sourcing that determine who earns the credit and at what value. The headline changes: annual matching is allowed through 2029, hourly matching begins in 2030, deliverability regions are codified, and there are new incrementality pathways for certain states and nuclear plants. Read the details in the Final 45V regulations.
Those mechanics cascade into real project economics. Green projects now have a near term path if they can source qualifying Energy Attribute Certificates, while blue projects face a clearer bar for lifecycle emissions. Add in a turbulent year for DOE’s hydrogen hubs funding and 2025 looks like a reset that sorts winners from nice-to-have ideas.
The carbon thresholds that set the stakes
45V’s value still flows from lifecycle emissions per kilogram of hydrogen, measured with the 45VH2-GREET model and verified annually. The tiers are unchanged in structure but now backed by a mature rule set:
- 4.0 kg CO2e per kg H2 or less qualifies for the credit.
- 2.5 to 1.5 kg CO2e per kg H2 earns about one third credit.
- Below 1.5 to 0.45 kg CO2e per kg H2 earns roughly one third plus.
- Below 0.45 kg CO2e per kg H2 earns the full credit amount, subject to prevailing wage and apprenticeship for the multiplier.
Because the credit scales with intensity, the electricity rules are now the hinge of green project viability, and methane leakage plus capture rate are the hinge for blue.
Matching and deliverability, clarified
Three pillars govern electricity for electrolyzers when using EACs:
- Incrementality
- 36 month lookback remains the default. EACs must come from new clean generation with commercial operation dates within 36 months of the electrolyzer being placed in service.
- Qualifying State pathway: if both the generator and hydrogen facility are in a qualifying state with a stringent decarbonization standard and a power sector greenhouse gas cap, the EAC can meet incrementality even if the generator is older. As of the final rule’s publication, California and Washington qualify under this pathway.
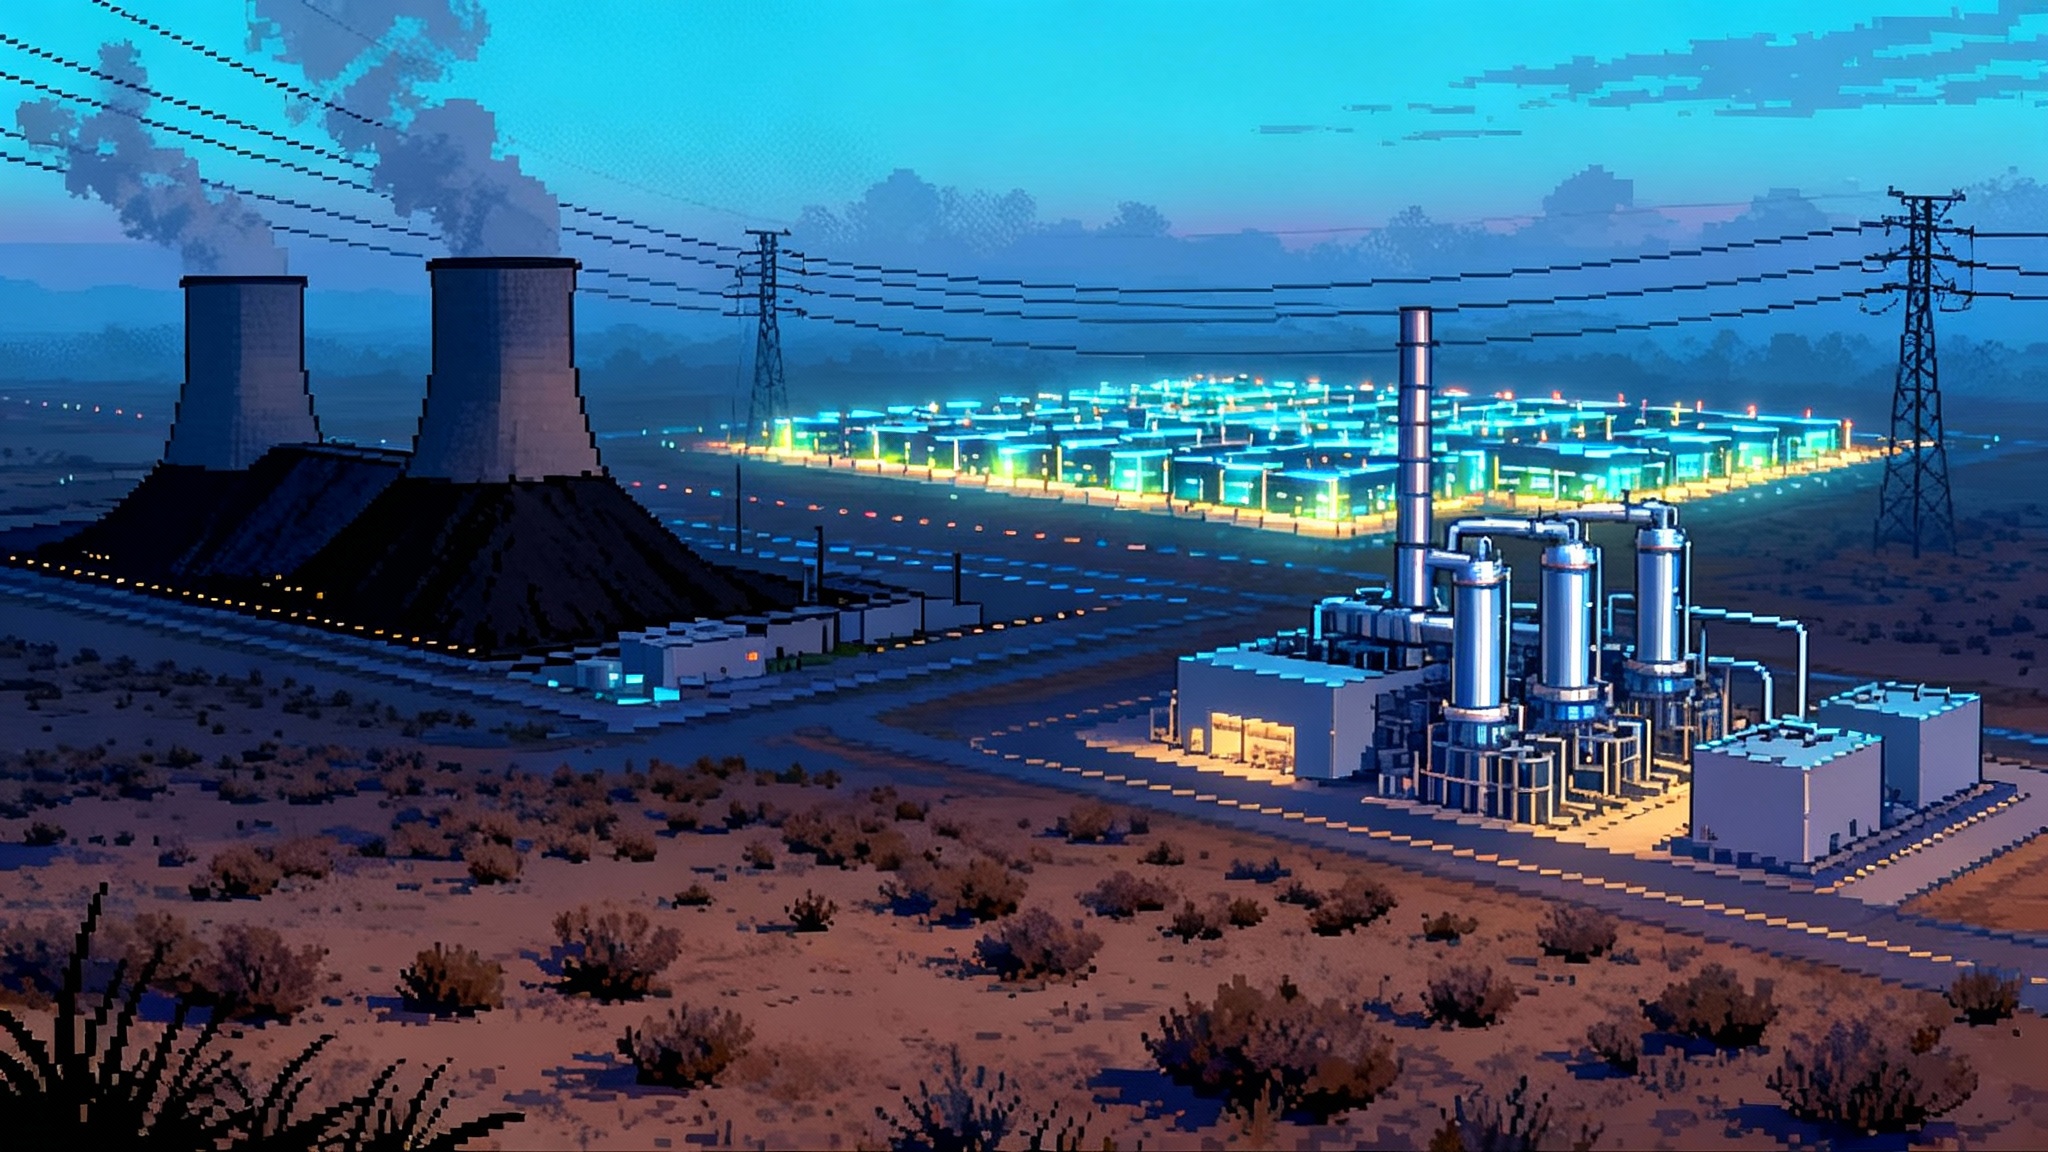
- Nuclear pathway: EACs from a qualifying nuclear reactor can meet incrementality up to 200 MWh per operating hour per reactor, with conditions. The reactor must be merchant or a single unit plant, meet a financial test based on 2017–2021 data, and either have a behind the meter connection to the electrolyzer or a 10 year EAC supply agreement that manages price risk. The 200 MWh per hour cap can be aggregated across integrated reactors under common control. Fuel availability and enrichment are evolving, as covered in the 2025 enrichment sprint.
- Temporal matching
- Annual matching is allowed for 2025 through 2029.
- Hourly matching starts in 2030 for all producers using EACs, regardless of in service date. That means hourly EACs need to be available, and electrolyzer dispatch must align with hourly clean supply or storage.
- Deliverability
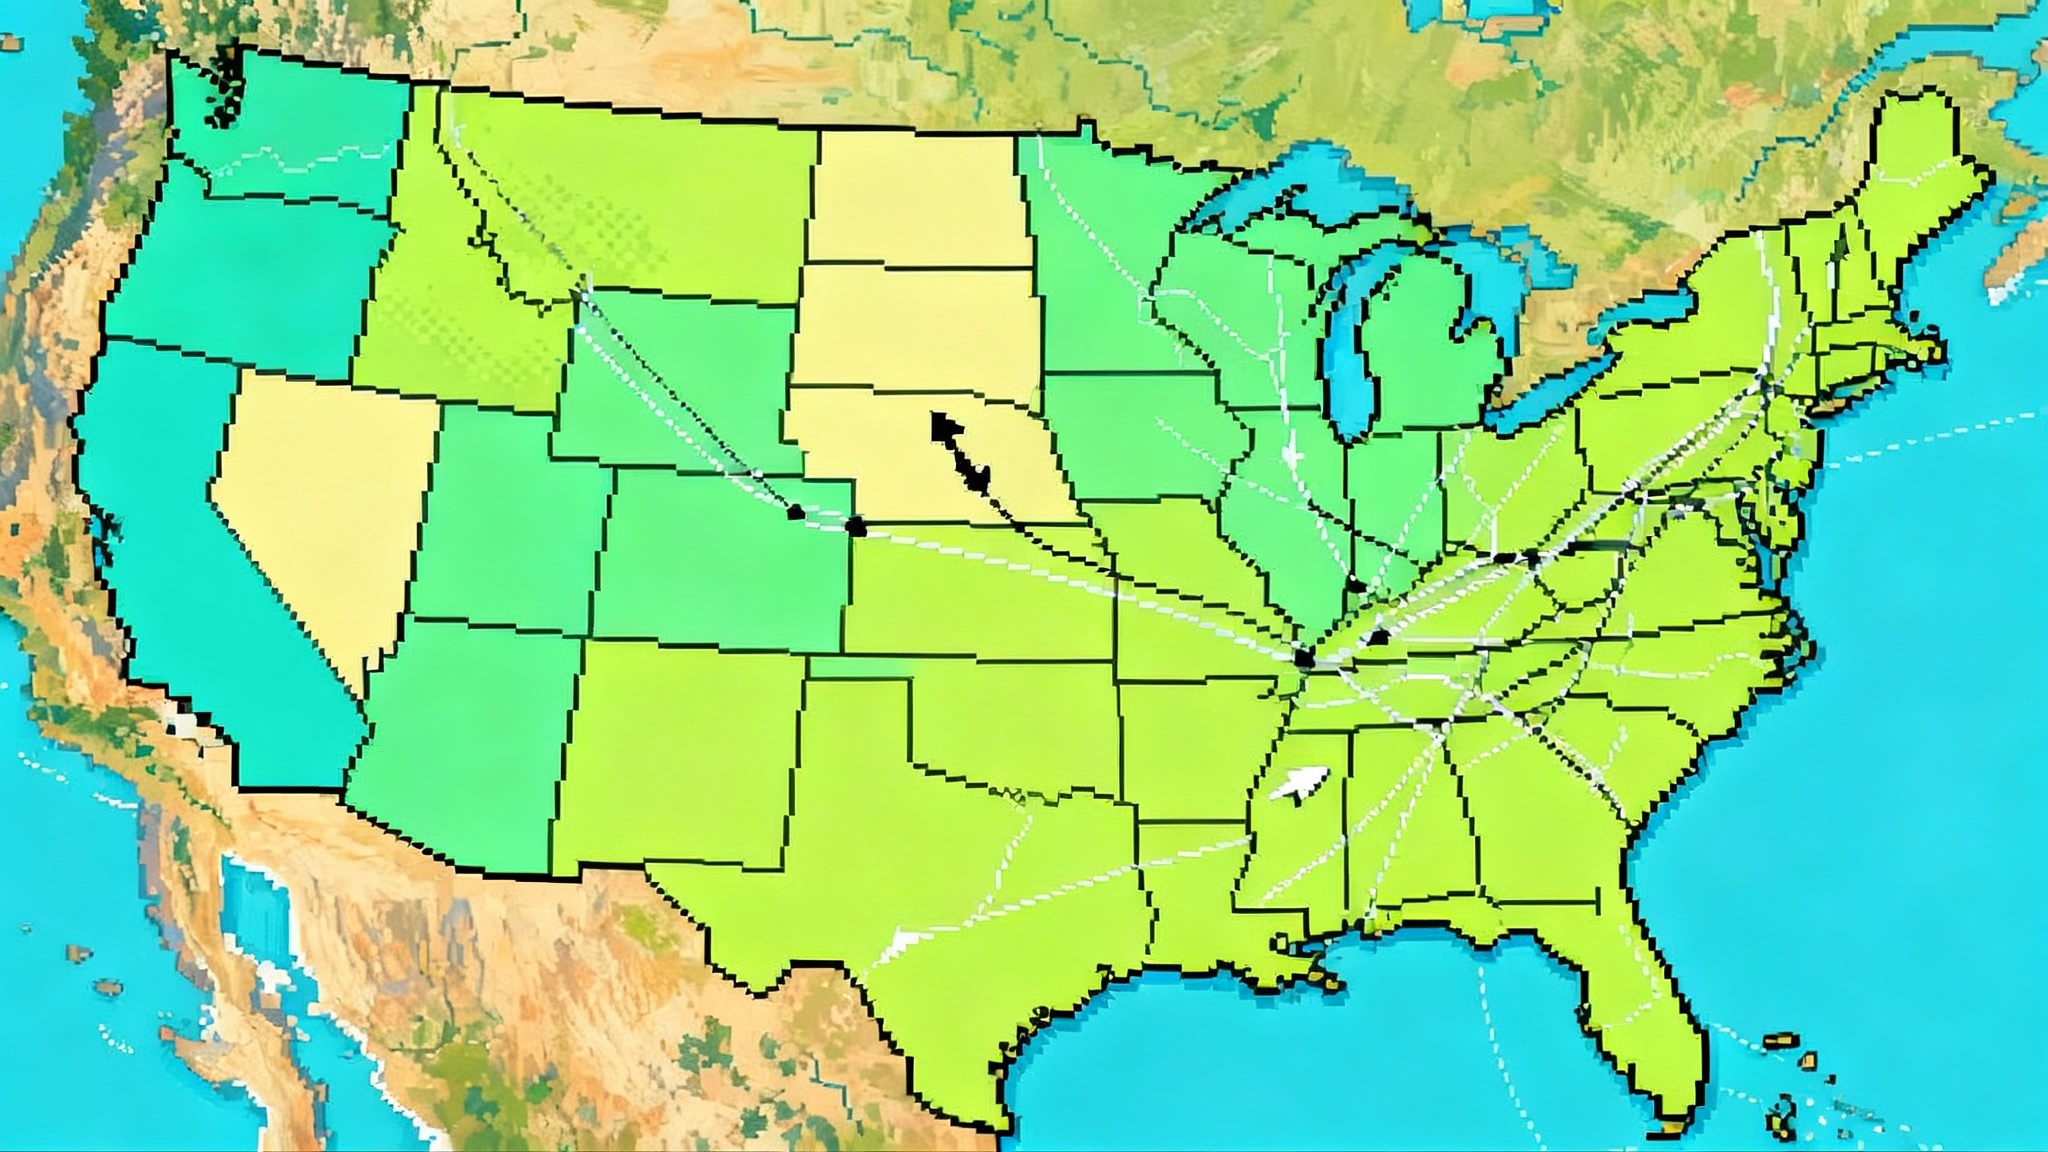
- EACs must be from a generator in the same Treasury deliverability region as the hydrogen facility, or prove verifiable cross region delivery. The final rule allows real, trackable interregional delivery, for example through a direct high voltage connection, but does not otherwise phase in or relax deliverability. In the West, deliverability intersects with the West’s two-market era, which will shape sourcing strategies and price spreads.
The upshot: green projects have a five year window to build scale under annual matching, but they still need genuinely incremental power and regional deliverability. The 2030 shift to hourly will reward projects that co locate with storage, nuclear, or very high capacity factor renewables.
What this does to green vs blue economics
Green hydrogen
- Near term tailwind: Annual matching through 2029 lowers the cost of compliance versus hourly, reduces curtailment losses, and shortens the list of added technologies a project must buy on day one. Projects in California and Washington get an extra boost from the qualifying state incrementality path, which allows certain existing clean resources to count.
- Structural constraints: Deliverability limits arbitrage of cheap EACs from faraway grids. The 36 month incrementality rule still pushes developers to sponsor or contract new build renewables or nuclear supply. Hourly matching in 2030 will favor co location with long duration storage, nuclear linked offtake, or sites with predictable wind and solar complementarity.
Blue hydrogen
- Clarity on the bar: The rule set makes it clear that to hit the full credit tier a fossil with CCS pathway must pair very high capture efficiency with very low upstream methane intensity. Many blue projects are likely to land in the mid tiers unless they can guarantee stringent leak detection and repair upstream and achieve deep process capture. Recent federal policy shifts on methane also matter for costs and timelines; see the context in EPA methane fee changes.
- Infrastructure is destiny: Blue projects near mature CO2 pipelines and class VI storage with permitting momentum will move first. Those that depend on long greenfield CO2 corridors or slow storage approvals will be timeline constrained even if plant level capture is ready.
Bottom line
- 2025 through 2029 favors green projects that can line up incremental regional clean power and strong offtake, plus blue projects on the Gulf Coast and Mid Continent with existing CO2 transport and storage options. The 2030 hourly switch increases the value of pairing with nuclear, storage, and high capacity factor renewables.
The 2025 hub shake up, briefly
DOE’s Regional Clean Hydrogen Hubs program entered 2025 amid reviews and pauses that introduced uncertainty into multi state portfolios. A Congressional Research Service brief describes executive actions and spending reviews that could alter the timing and scope of hub outlays, which in turn influences near term balance sheets and confidence for anchor projects. See the CRS insight on hub spending impacts for the policy context.
Press reporting through spring 2025 pointed to possible reductions or re sequencing for several hubs, with Gulf Coast and certain Midwest projects seen as more resilient thanks to industrial demand and existing pipelines. Regardless of the final funding profile, hubs now operate alongside a settled 45V that can carry well structured projects to FID even if public co funding is thinner or slower.
Who reaches FID in 2026–2028
Most likely
-
Gulf Coast industrial clusters
- Why: Existing hydrogen demand in refining and chemicals, dense CO2 pipeline networks, salt dome storage, port export optionality, a labor pool that can execute at scale, and at least some hub tranche funding already in motion. Grid upgrades like ERCOT’s 765 kV build will also shape long run power pricing and deliverability.
- What: Blue hydrogen for refinery hydrotreating and hydrocracking, low carbon ammonia with CCS, hybrid hubs where electrolysis covers ramping and CCS hydrogen provides baseload.
-
Upper Midwest and Great Lakes belt
- Why: Nuclear paired electrolysis using the nuclear incrementality path, onshore wind growth, and industrial offtakers in ammonia, glass, and steel. Deliverability within regional boundaries is manageable and siting can leverage existing industrial land.
- What: Electrolytic ammonia at existing fertilizer complexes, pilot DRI steel with hydrogen blends, nuclear connected electrolyzers sized under the 200 MWh per hour per reactor cap to de risk operations before hourly matching arrives.
-
Pacific Northwest coastal nodes
- Why: Washington’s qualifying state status, hydropower as backbone, and strong policy signals for heavy transport. Even with hub uncertainty, private capital plus 45V can move truck corridor fueling and port equipment projects that do not require mega scale capex to start.
- What: Electrolyzers for ammonia bunkering pilots, port drayage fueling, and industrial gas blends in pulp and paper where feasible.
Plausible with the right offtake and EPC discipline
-
California transportation and export oriented projects
- Why: The qualifying state path supports incrementality and demand pull from fleets and ports is real, but siting, interconnection, and power prices demand careful structuring. Early projects that tie directly to off peak clean power or storage and that lock multi year EACs will move faster.
- What: Heavy duty refueling corridors, early maritime ammonia pilots, and refinery blending that displaces merchant hydrogen purchases.
-
Mid Atlantic industrial decarbonization pilots
- Why: Strong policy framework yet more complex deliverability and grid conditions. Success hinges on a short physical distance from clean power or on contracted nuclear supply under the rule’s nuclear path. Smaller first units with clear expansion triggers are more likely to finance.
Laggards
-
Merchant export only mega projects without domestic anchors
- Why: Contracting risk in offtake and currency exposure, deliverability constraints on power sourcing, and higher EPC complexity. These are likely to slip until there is a premium export contract that survives lender scrutiny.
-
Blue projects far from CO2 infrastructure
- Why: Pipeline permitting, storage primacy status, and sequestration monitoring create timelines that do not fit 2026–2028 FIDs unless the developer already controls geology and rights of way.
Knock on effects you should plan for
Power markets and PPAs
- Expect a wave of long tenor PPAs and tolling style contracts sized to electrolyzer duty cycles, with shapes that minimize curtailment under annual matching and evolve toward hourly shape by 2030. Storage adders will be cheaper to buy in 2027 than in 2031 if early adopters secure supply chain priority.
EAC and REC pricing
- Incrementality and deliverability tighten the eligible pool of certificates. Prices for deliverable EACs in regions with tight reserve margins or few new builds should trade at a premium. The first credible hourly EAC products by registry in 2028–2029 will command an even higher premium because 2030 compliance is universal for EAC users.
CO2 transport and storage
- Hubs along the Gulf Coast, Illinois Basin, and parts of the Dakotas have a path to firm transport and storage with multiple counterparties. States with class VI primacy remain advantaged on permitting timelines. Developers should assume 36 to 48 months from final storage characterization to sustained injection and bake that into EPC and offtake ramp schedules.
Export contracts
- Ammonia exporters targeting Asia will need to certify intensity at the ship rail, so metering, verification, and custody chain investments are not optional. European buyers will increasingly require proof of hourly matching after 2030, which will favor nuclear connected and storage paired projects for export parcels.
What to do now if you are a developer, buyer, or investor
-
Developers
- Lock deliverable, incremental power now. If you operate in California or Washington, size early units to the qualifying state path and set up a glide path to hourly by adding storage or nuclear supply by 2029.
- For blue, finish Class VI and pipeline de risking before FEED is complete. Your FID will rise and fall on storage.
- Design plants for modular expansion. Early trains can bank 45V while you add storage or firm clean power ahead of 2030.
-
Large buyers
- Prioritize baseload industrial uses that can tolerate stepwise volumes, for example refinery hydrogen pools and ammonia plants. Use take or pay contracts with clear performance windows that fit annual matching today and hourly matching tomorrow.
-
Investors
- Favor regions with deliverability headroom and low EAC scarcity risk. Underwrite a post 2030 cash flow that includes storage or nuclear sourced hours. Reward projects that treat verification as core infrastructure, not a paperwork exercise.
A practical timeline
-
Q4 2025 to 2026
- First green projects reach FID in California, Washington, Gulf Coast, and the Upper Midwest with annual matching and clear deliverability. Blue FIDs concentrate along the Gulf Coast and in the Illinois Basin where CO2 infrastructure is mature.
-
2027
- Electrolyzer deliveries scale, more EAC registries pilot hourly products, and storage adders begin to show up in PPAs. Nuclear linked electrolyzers under the 200 MWh per hour cap reach mechanical completion at one or two sites.
-
2028
- A second wave of green and blue FIDs closes, anchored by ammonia and refinery demand, with some first cargo export agreements signed. Early hourly EAC markets form, setting price signals for 2030 compliance.
-
2029
- Commissioning of several hub anchored or hub adjacent projects. Developers bolt on storage and revise dispatch to prepare for hourly.
-
2030
- Hourly matching is in force for any hydrogen output represented by EACs. Projects with nuclear supply or storage show higher capacity factors and premium contract pricing.
The bottom line
With the rulebook in place, 45V now rewards real emissions performance and disciplined power sourcing. The five year bridge to hourly matching gives well structured green projects time to scale, while blue projects with proven CO2 logistics can move now. Regions with industrial demand and infrastructure will lead, and the rest of the market will follow the price of deliverable clean power and the availability of verifiable storage for carbon and electrons. The winners in 2026–2028 are those who underwrite to the 2030 world and build the compliance pathways into their contracts today.
