The Interconnection Fast-Track Arrives: AI Unclogs the Grid
In 2025, grid operators opened temporary fast-track lanes and deployed AI to triage interconnection queues. Here is what that unlocks for 2026 to 2029 builds, who benefits, and how to move now.
Breaking in 2025: the queue stops being theoretical
For years, the interconnection queue was a slow moving traffic jam, a long line of projects inching toward a study that might not finish before the business case evaporated. In 2025 the script flipped. Multiple grid operators introduced temporary fast-track lanes and began deploying artificial intelligence to accelerate the hard engineering work of power flow, stability, and deliverability studies. The Midcontinent Independent System Operator secured federal approval for a limited duration fast-track called the Expedited Resource Addition Study, with a cap of 68 projects through August 31, 2027, and clear guardrails on timing and eligibility. It is the first concrete, system level valve opened to relieve pressure in the heart of the United States interconnection backlog, and it is already changing developer behavior and utility procurement conversations. MISO’s approved ERAS details spell out the cadence and criteria.
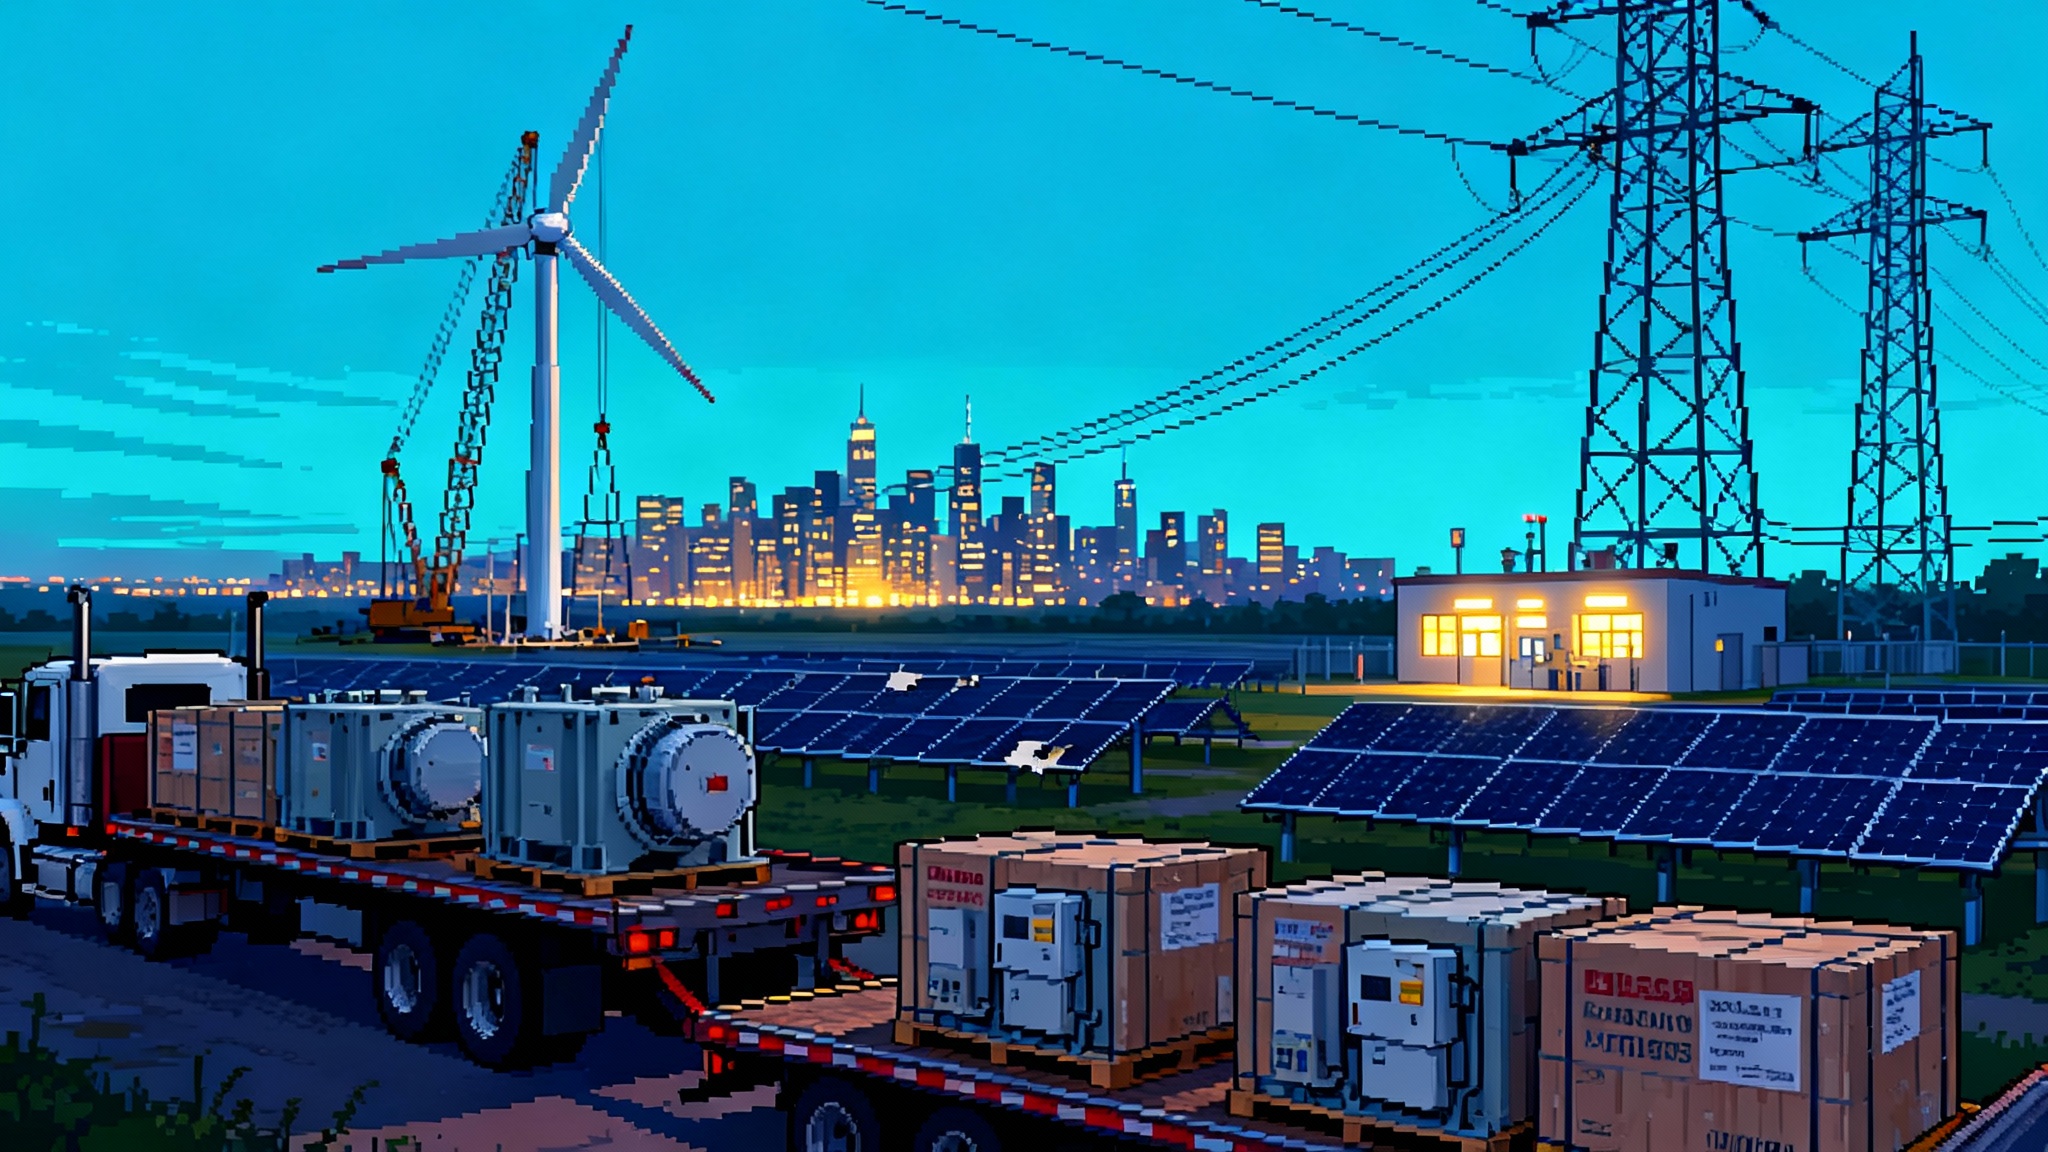
The immediate takeaway is simple. There is now a path for near term megawatts that can reach commercial operation within three to six years and that solve an identified reliability or load addition problem. That path rewards projects that are real, properly sited, and technically conservative. It discourages speculative queue placeholders. The fast track is not a shortcut around reliability. It is a triage protocol that gets steel in the ground where the need is highest, including load growth from AI data centers ignite capex.
What changed under the hood
Two forces converged in 2025. First, fast-track pathways that do not replace the full cluster process but give a temporary, targeted outlet for urgent needs. Second, the adoption of artificial intelligence and high performance automation to chew through the time consuming parts of interconnection studies.
PJM Interconnection, the largest Regional Transmission Organization in the country, announced a multi year collaboration to bring artificial intelligence into its planning and interconnection work. The point is not to let a neural network sign off on grid reliability. The point is to automate repetitive validations, generate candidate network upgrades, and maintain a living digital model of the grid so engineers spend their time on the edge cases that truly require judgment. Early rollouts began this year. The aim is to cut average study times materially without sacrificing conservatism. Reuters captured the milestone in April when PJM and Google described the plan to apply artificial intelligence to queue management and planning models. See the report on Google and PJM’s AI collaboration.
Southwest Power Pool followed with its own artificial intelligence initiative focused on interconnection analysis and transmission planning throughput. Taken together with the Midcontinent fast track and PJM’s reliability resource efforts, 2025 became the year grid operators stopped asking whether automation could help and started reorganizing workflows around it.
How the new interconnection triage works
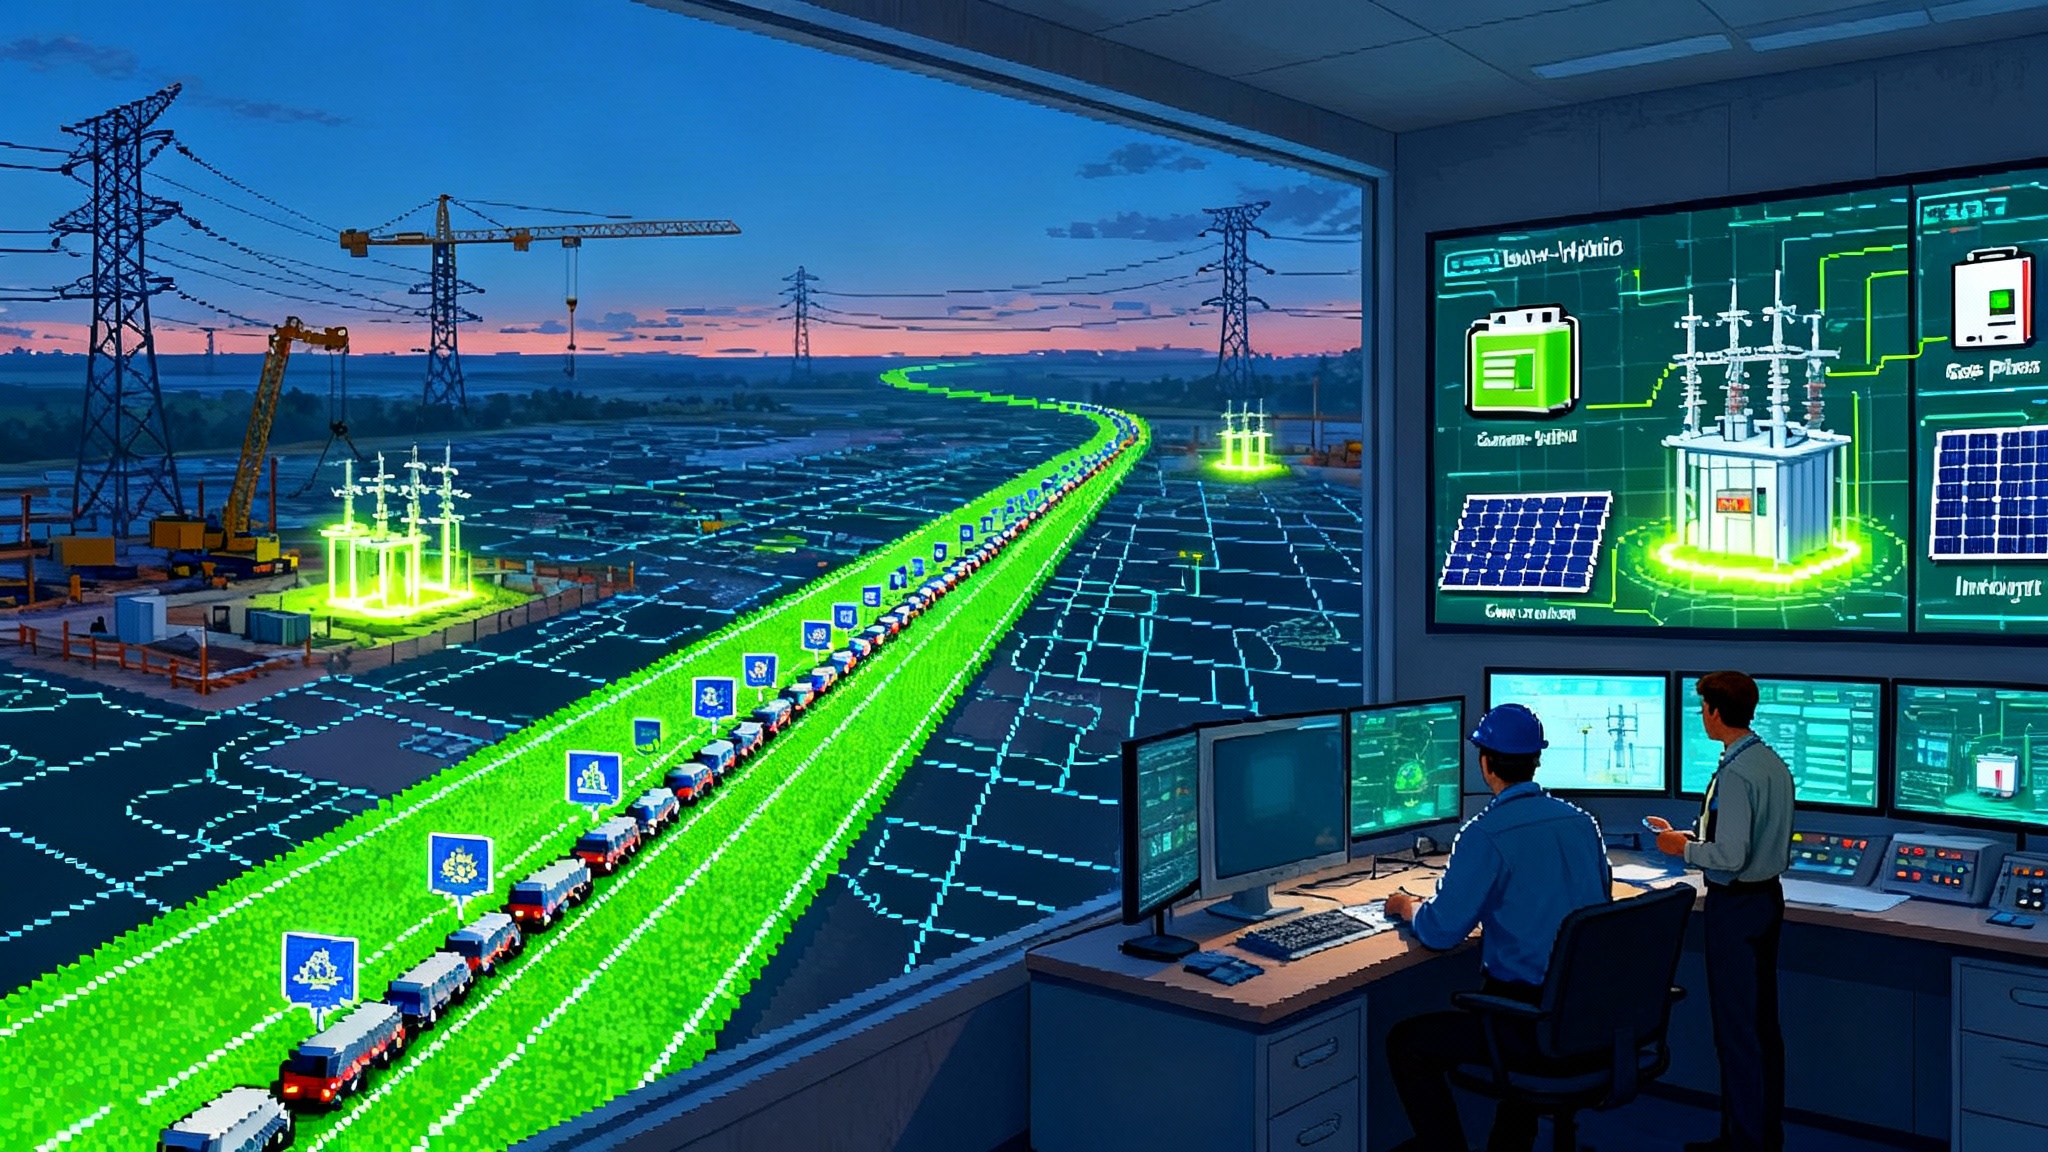
Think of the legacy process as a two lane highway through a mountain pass. Every truck gets weighed and inspected one at a time, even if many carry the same cargo and route. The fast track and artificial intelligence assisted tools do three things.
-
They add a dedicated lane for critical deliveries, with a fixed daily quota, a clear destination, and a police escort. Projects must prove that they serve a specific load addition or resource adequacy need. They must also be able to reach commercial operation within a tight window. The cap on accepted projects keeps the lane moving.
-
They automate inspection. Artificial intelligence helps assemble standard study cases, flags data gaps, proposes typical upgrade packages, and runs large batches of contingencies in parallel. Human engineers review the flagged items and edge cases. The result is fewer calendar days wasted on setup.
-
They reward fully scoped designs. Projects that arrive with accurate models, realistic performance assumptions, and site control glide through intake. Projects that arrive half baked hit a readiness wall and fall back to the traditional queue.
Near term winners and why
This shift does not lift all boats equally. Some technologies fit the new lane and artificial intelligence assisted study protocols better than others, particularly when the need is tied to fast growing load and reliability at specific substations or corridors.
-
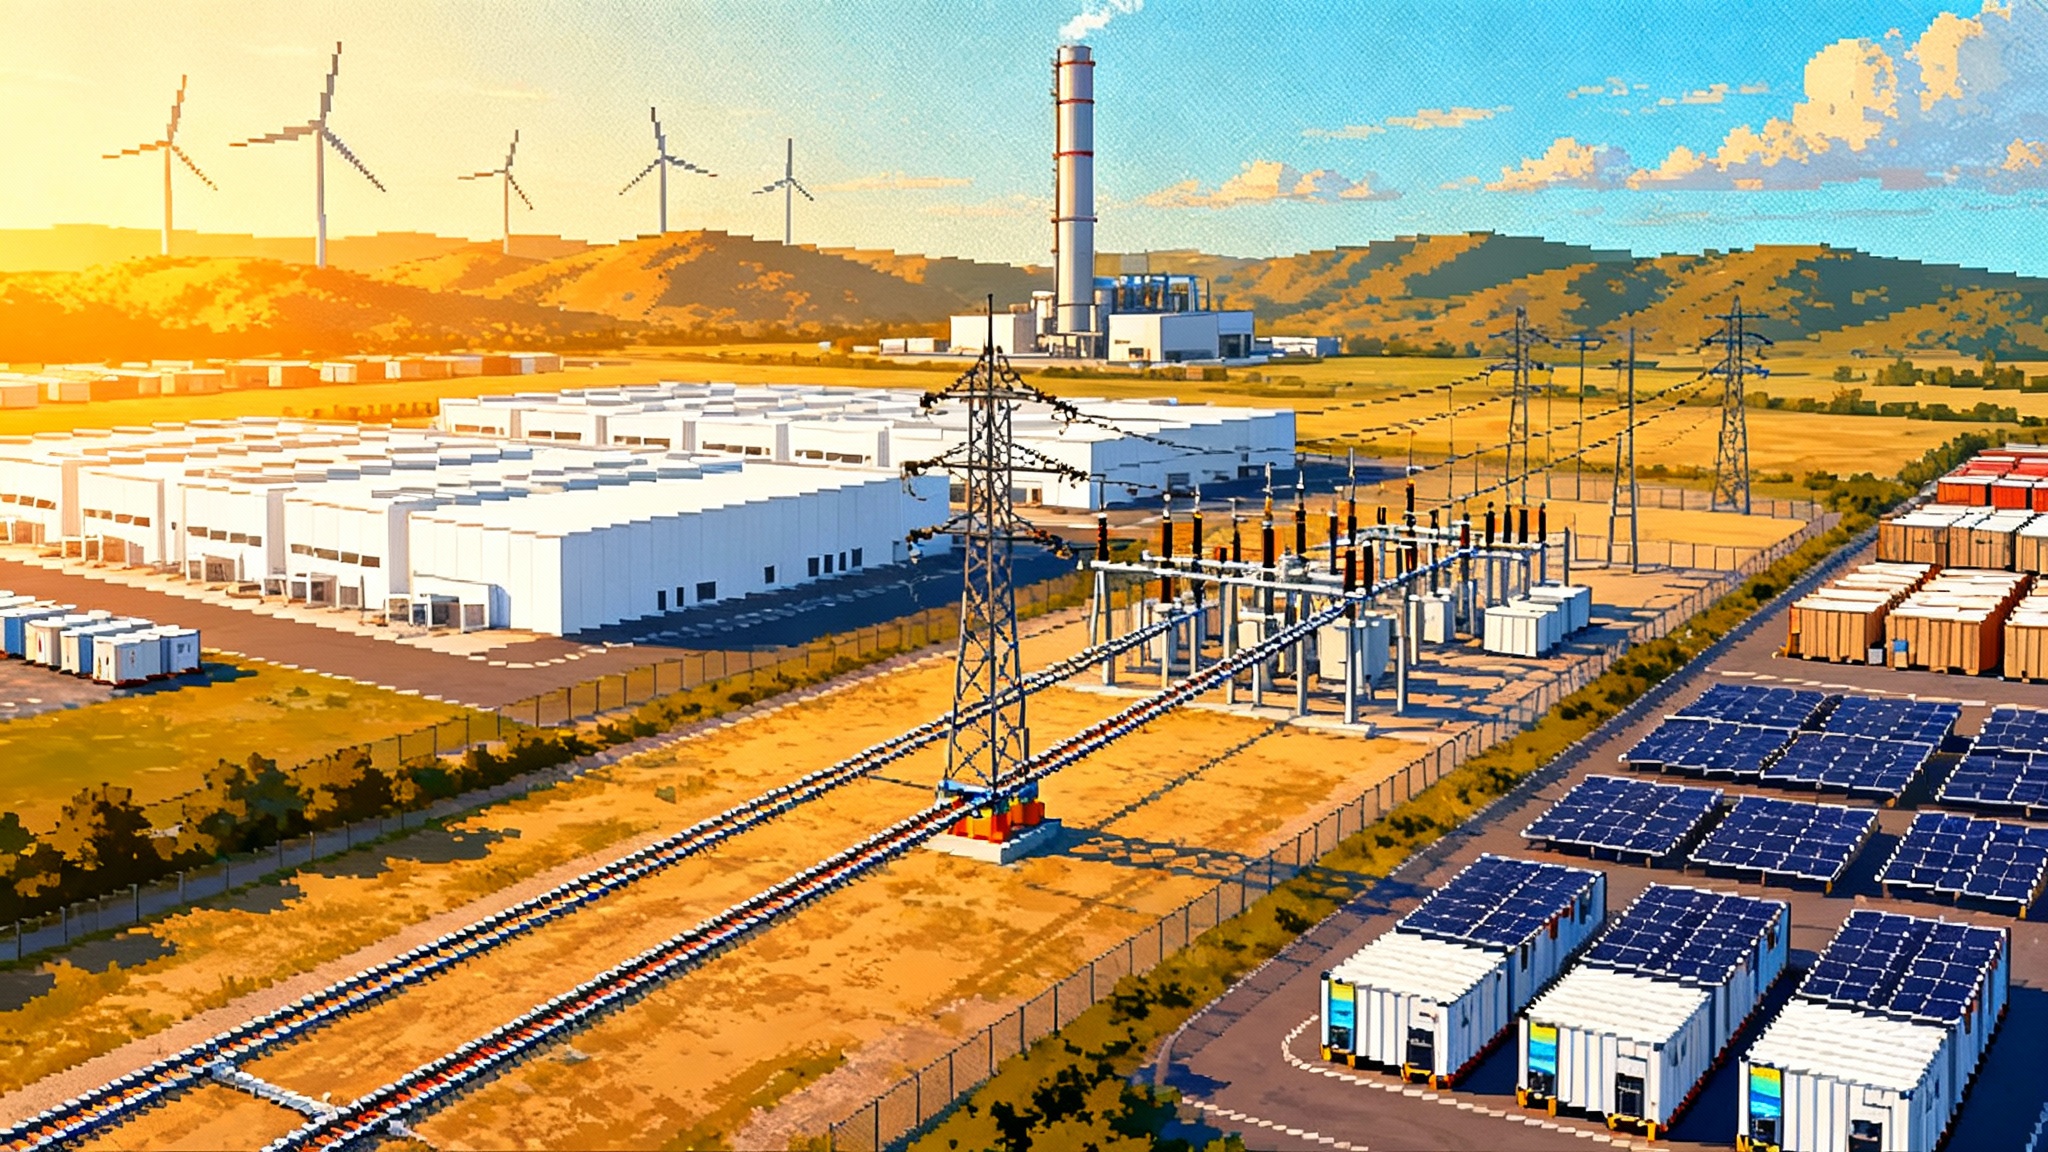
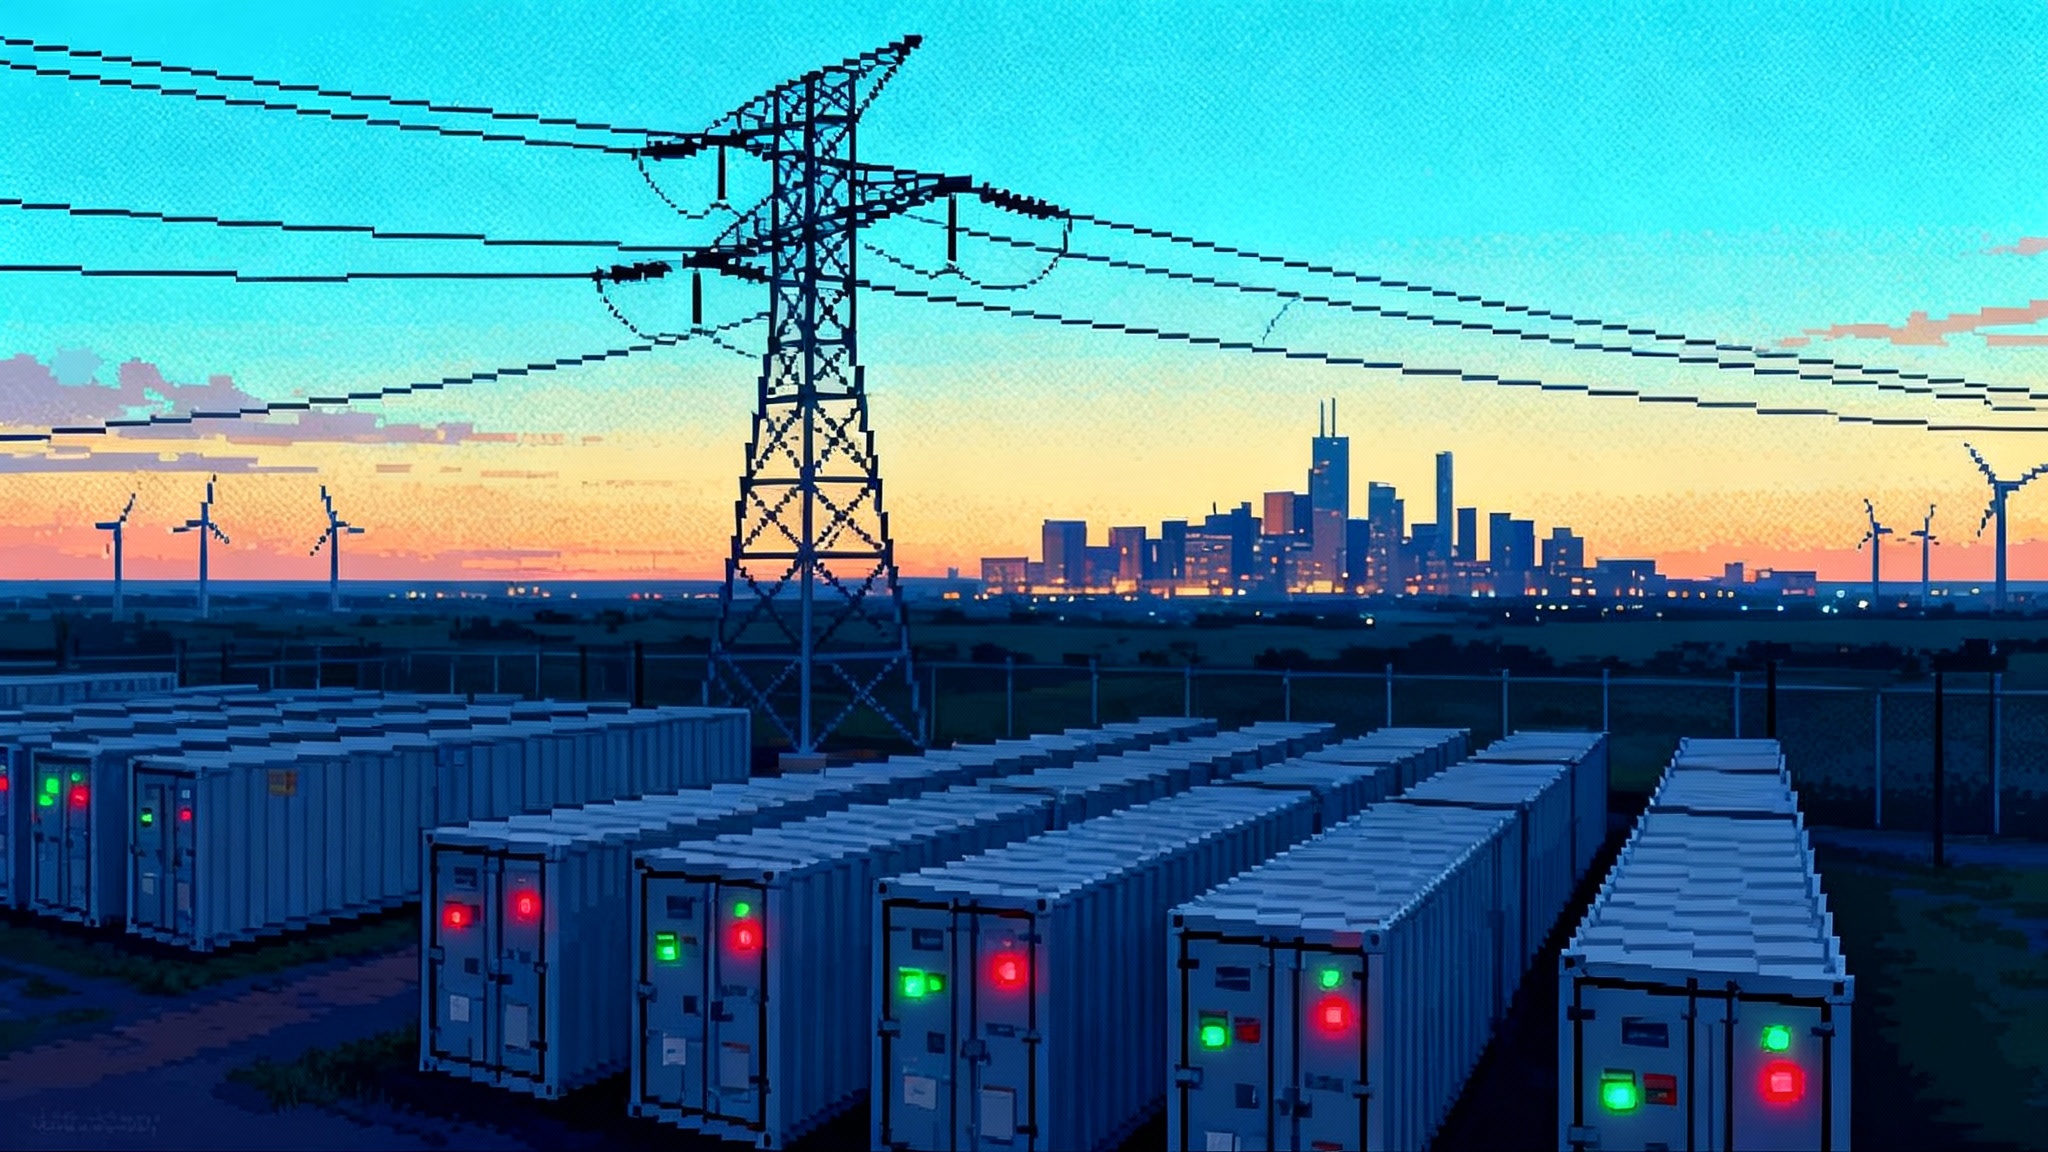
Storage plus solar hybrids. Co located projects that share a point of interconnection are explicitly supported by federal interconnection rules, and they give operators dispatchable flexibility at the same substation that solar alone cannot provide. Four to six hour battery systems can shift midday solar into evening peaks, provide local voltage support, and reduce the size of required network upgrades because the battery can limit net injection at times of congestion. In practice, a 200 megawatt solar field paired with a 200 megawatt, 800 megawatt hour battery can present as a 150 to 180 megawatt interconnection request with a firm cap, which cuts the upstream upgrade bill. That profile matches the triage lane’s reliability test and shortens the path to revenue.
-
Flexible natural gas peakers. Fast start aeroderivative turbines and modern reciprocating engine plants are not the headline the energy transition wants, but they are the resource adequacy backstop the queue now accelerates when the load spike is real. They can be sited at brownfield interconnections, they clear local adequacy deficiencies with low construction risk, and they can be built in two to three years. When the interconnection lane requires that a project be operational within three to six years, these units fit by design. Developers increasingly propose hybrids where a modest battery handles ramping and a small peaker covers rare long duration events. The capital intensity per kilowatt is higher than a combined cycle, but the time to first kilowatt is the currency that matters in a fast track governed by deadlines.
-
Grid forming inverters. Across the independent system operators, requirements are tightening for inverter based resources to support voltage and frequency during disturbances and to ride through faults more like synchronous machines. Projects that arrive with grid forming inverter capability have a much easier path through stability screens. The modeling is clearer, the operational value is explicit, and the upgrades they displace are costly. Expect procurement specifications for new solar and battery projects in 2026 and 2027 to default to grid forming capability, even in regions where it is not yet mandatory.
Other near term beneficiaries include dynamic line rating packages that unlock spare capacity on existing lines, remedial action schemes that reduce the need for large network rebuilds, and synchronous condensers that solve local strength issues and keep inverter projects in the fast lane. For more on this toolkit, see how dynamic line ratings surge.
What this unlocks for 2026 to 2029
Here is the practical build outlook if the 2025 moves hold.
-
2026. First wave of fast tracked projects reaches final interconnection agreements. Local reliability projects dominate. Expect a visible bump in utility scale battery installations in Midcontinent and Southwest Power Pool footprints, paired with modest solar additions at existing substations. PJM’s reliability resource selections add several gigawatts of quick to build capacity. Load serving entities, which are utilities and retail suppliers that serve end use customers, write short tenor contracts to secure resource adequacy for the next two to four years while longer lead resources work through the standard cluster.
-
2027. Second wave of hybrids with grid forming inverters moves to construction. Natural gas peakers at brownfield sites fill the largest near term gaps as data center campuses and industrial loads energize. Expect a temporary increase in the share of gas capacity additions that later operate at low capacity factors, because their job is insurance. On the clean side, battery centric portfolios under five interconnections per portfolio flourish, because each interconnection path is now precious and must carry more value per point of interconnection.
-
2028. The artificial intelligence assisted study pipeline starts to change the shape of the queue itself. With intake screening and model automation, cluster cycle time falls from multi year to roughly one to two years in regions that have reorganized around automation. The projects that make it through have higher readiness and better locational fit. Transmission upgrades that were identified in 2024 and 2025 begin to energize, relieving some curtailment hotspots and opening capacity for the 2026 class of projects to connect.
-
2029. The mix turns back toward clean, dispatchable hybrids and standalone storage in regions where fast tracked peakers have stabilized the adequacy picture. Grid forming capability is the default in purchase specifications. Interconnection attrition, the silent killer of development pipelines, declines because developers can see the upgrade bill earlier and pivot before sunk costs grow.
The takeaway is not that the fast track builds the transition on its own. It is that the fast track and artificial intelligence tools bend the near term curve enough for transmission and longer lead resources to catch up.
Curtailment risk in the fast track era
Curtailment risk is shifting from a generic fear to an addressable engineering problem for many projects. Three mechanisms matter.
-
Interconnection caps tied to dispatchability. Where the fast track asks for a firm cap and a local adequacy need, batteries allow developers to right size injections. That reduces the frequency of uneconomic spillage, particularly in the first years before regional upgrades land.
-
Grid forming behavior. When solar and batteries behave more like synchronous machines during disturbances, they pass stability screens that used to trigger conservative limits. Fewer conservative limits mean fewer unexpected curtailments.
-
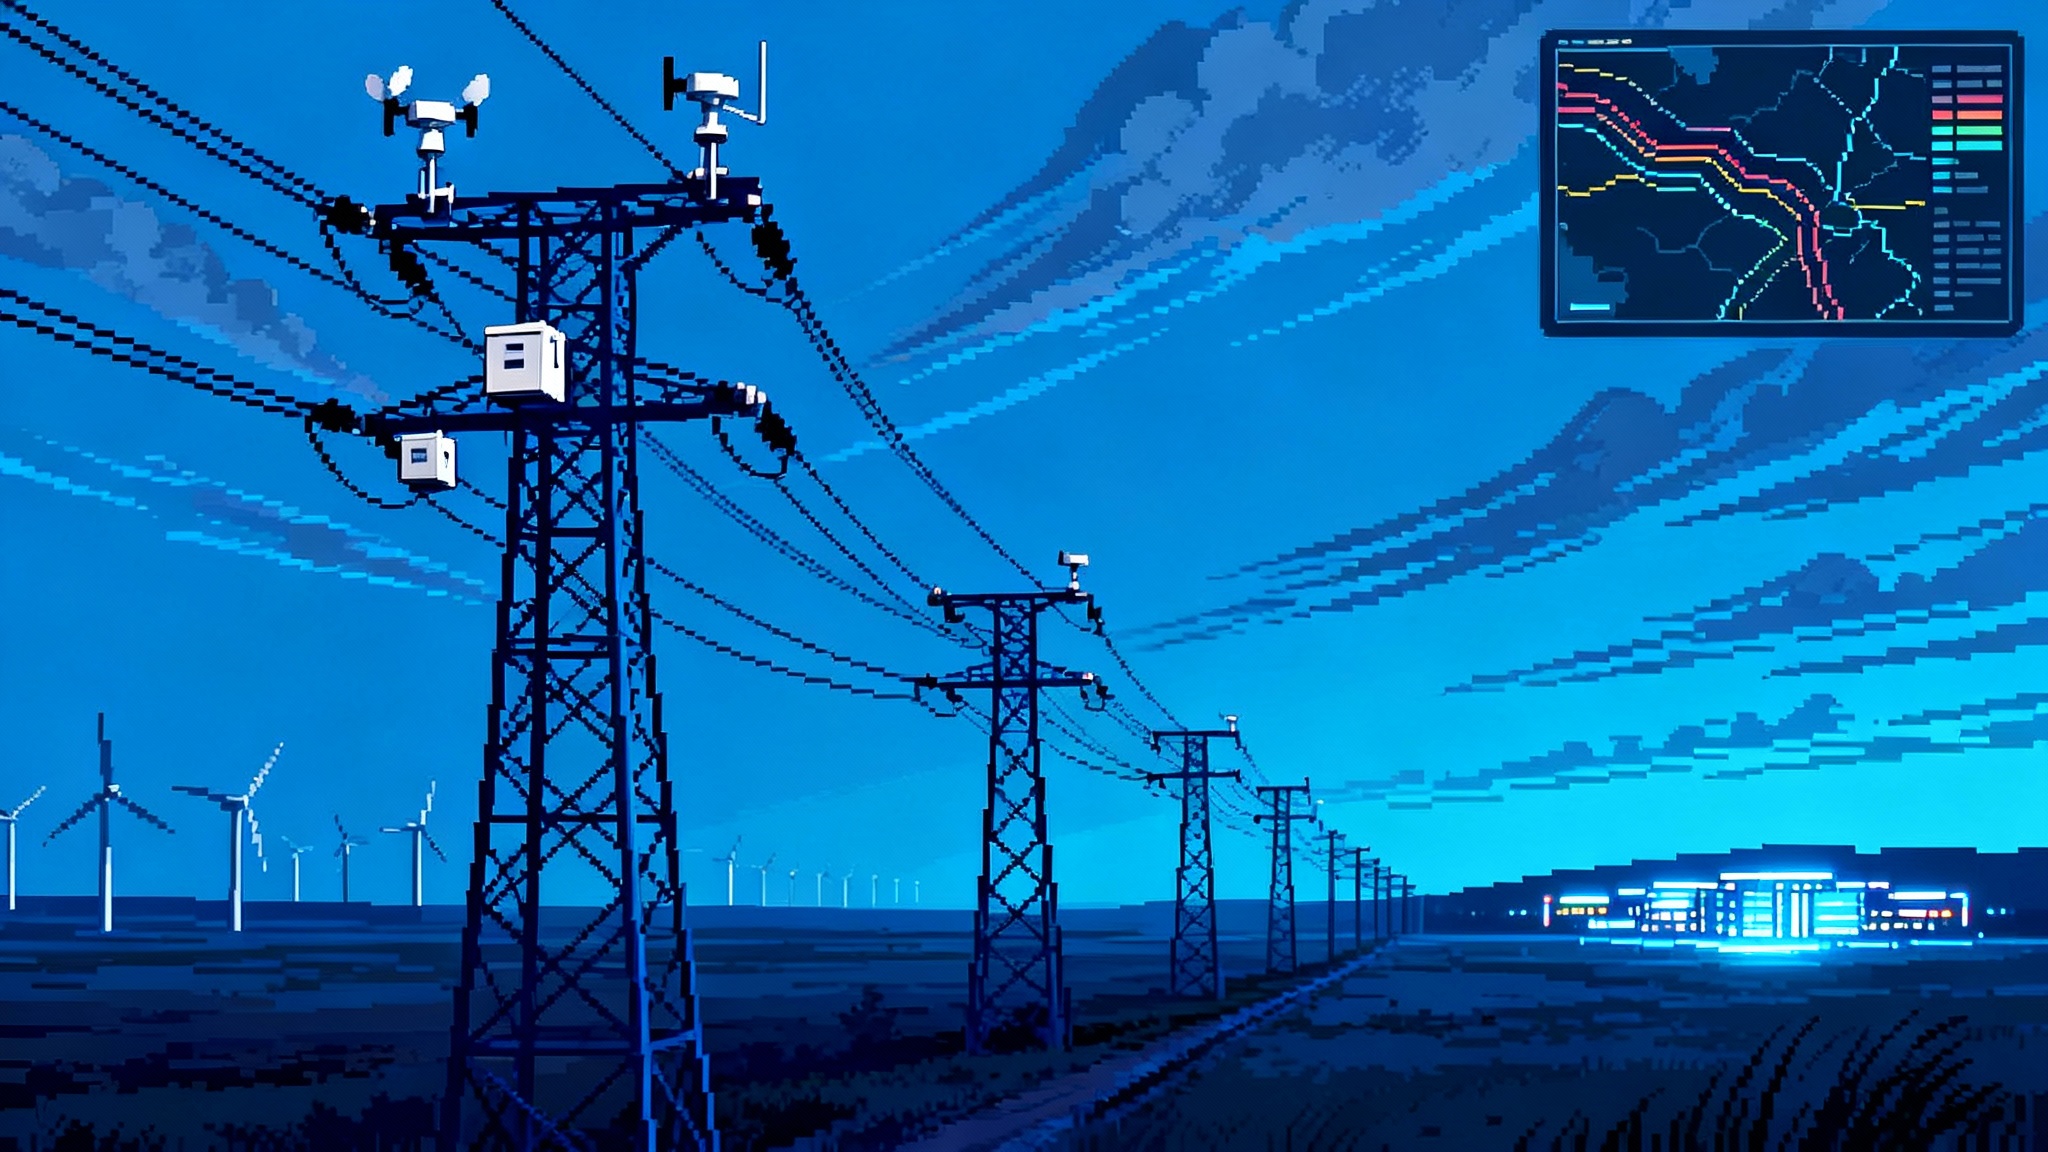
Data visibility. Artificial intelligence assisted study environments keep an updated digital twin of the local network. Developers can see congestion risk earlier and design around it, for example by adding remedial action schemes that allow full output except during a narrowed set of contingencies.
Expect curtailment risk to fall most in projects that share a substation with new batteries and in regions where transmission owners are adopting dynamic line ratings and fast switching schemes. Projects that are large, inverter only, and far from load without a firm cap remain exposed.
Capital expenditure priorities that move projects faster
With the rules of the road changing, the priority list for capital now looks different.
-
Interconnection ready packages. Pay earlier for detailed models, grid forming capabilities, and remediations that avoid large upstream upgrades. The spending may add 5 to 10 percent to engineering costs but can shave a year off study time and reduce upgrade exposure by millions.
-
Brownfield capacity. Find retiring coal interconnections and colocate with storage or hybrid peakers. The permitting advantage stacks with interconnection advantages. Capacity transfer constructs in some regions allow faster reuse of rights from retiring plants.
-
Substation centric portfolios. Rather than scatter small solar sites across many rural buses, concentrate a few hybrids at substations with known headroom and clear load growth signals. The new triage lanes reward clarity of need and simplicity of interconnection.
-
Transmission enabling technologies. Dynamic line ratings, advanced protection, and synchronous condensers are now part of the developer toolkit. If a few million dollars of equipment avoids a one hundred million dollar network upgrade, the project economics and timeline both improve. These spends also make a developer a better partner for the transmission owner, which has influence over study assumptions and upgrade scoping.
Practical timelines for developers and load serving entities
Load serving entities, which are utilities or qualified retail suppliers responsible for serving end users, and developers can plan against the new cadence.
-
Next 3 months. In regions with a fast track window, gather letters from the relevant retail regulatory authority that confirm the load addition or adequacy need. Lock site control and interconnection data quality. For hybrids, finalize a firm cap strategy and battery operating constraints that align with reliability needs.
-
Next 6 to 12 months. Secure conditional offtake that allows a project to proceed while network upgrades are refined. For peakers, confirm gas supply and water arrangements early since those can add months. For batteries, line up grid forming inverter specifications and testing protocols with the transmission owner.
-
12 to 24 months. Expect draft interconnection agreements and a refined upgrade bill. Freeze major equipment and begin long lead procurement. If upgrades are light and permits are ready, start site work at risk to hit a three to four year commercial operation date window.
For load serving entities planning portfolios, the sequence looks like this.
-
2026 to 2027. Use short tenor contracts, two to four years, with peakers and batteries to cover adequacy during load ramp. Layer in tolling arrangements with hybrids that will deliver in 2028.
-
2028 to 2029. Pivot to longer tenor contracts as the automated cluster process delivers higher readiness clean projects. Add grid forming requirements to all new requests for proposals so that delivered megawatts support system strength and lower future curtailment risk. For market context, track capacity price shock in PJM.
Policy compliance that actually speeds construction
Paper reforms only matter if they translate into excavators and transformers. Several 2025 moves do exactly that.
-
First ready, first served mechanics with penalties for missed study deadlines have teeth. Transmission providers are aligning staff and tools to avoid penalties. Developers who miss readiness milestones are exiting earlier, which frees scarce engineering time for projects that can build.
-
Clear off ramps for retiring capacity. Some regions now allow retiring generators to transfer interconnection rights to replacement resources in months rather than years. That unlocks brownfield hybrids and peakers that can hit the fast track’s three to six year window.
-
Surplus interconnection service. Allowing underutilized interconnection service to be shared with a new resource makes it possible to add a battery at an existing plant with a streamlined study. The capacity that matters is the net injection limit at the point of interconnection. Batteries fit elegantly under that cap.
What to watch in 2026
Three signals will tell you whether the interconnection fast track and artificial intelligence wave are durable.
-
Study cycle time. If average interconnection study time falls into the one to two year band across at least three Regional Transmission Organizations, and if the variance narrows, then automation is doing more than press releases. Watch whether the draft study count per engineer month continues to rise.
-
Hybrid share. If the share of applications and approvals that are storage plus solar hybrids with firm caps rises year over year, the system is internalizing the value of dispatchable clean megawatts. That is a reliable leading indicator for curtailment moderation.
-
Brownfield build rate. If repowers at retiring plants accelerate, the link between policy and steel is intact. That is where fast tracked peakers and early batteries will concentrate because those nodes already have the right wires and community expectations.
The bottom line
The interconnection traffic jam is not gone, but 2025 finally put flaggers on the road and opened a dedicated lane for the trucks that must get through. The combination of artificial intelligence assisted studies and temporary fast track pathways does not change physics. It changes the order in which we apply physics to real projects. That alone is enough to advance hundreds of megawatts that would have waited years.
For developers, the message is to arrive ready, cap your injections, and bring grid forming capability as a default. For load serving entities, the task is to contract in two waves, short to cover the ramp and long to capture the cleaner, better sited projects that automation will surface. For policymakers and regulators, the job is to keep the temporary lanes focused on real needs, hold the line on study discipline, and invest in the transmission that turns this near term relief into durable capacity.
If that happens, 2026 to 2029 will look different from the last four years. Fewer studies will gather dust. More projects will pour footings. The grid will add flexibility where load is exploding, then open the door wider for cleaner megawatts. The fast track arrived in 2025. The work now is to drive it, carefully, all the way to steel in the ground.
