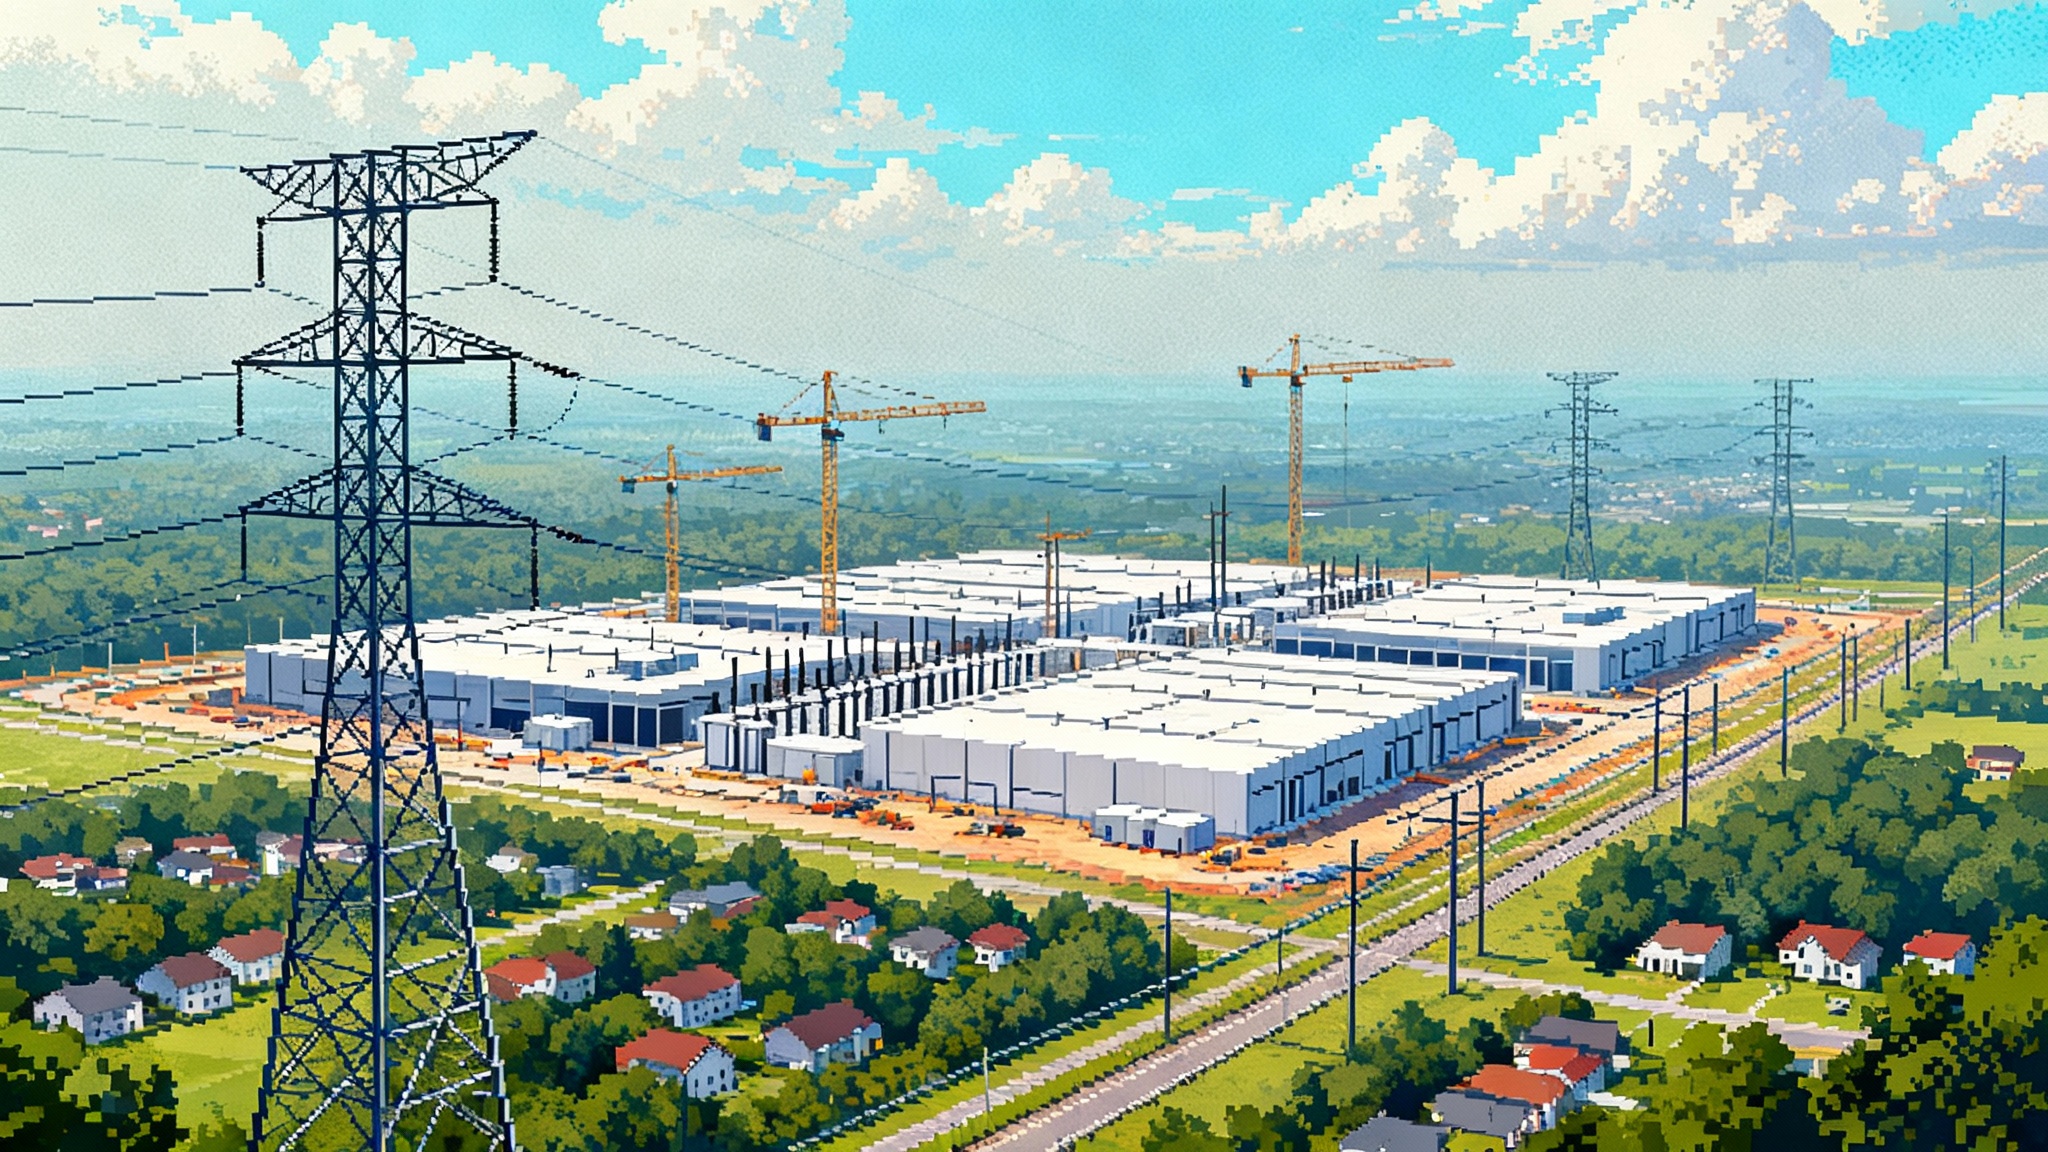
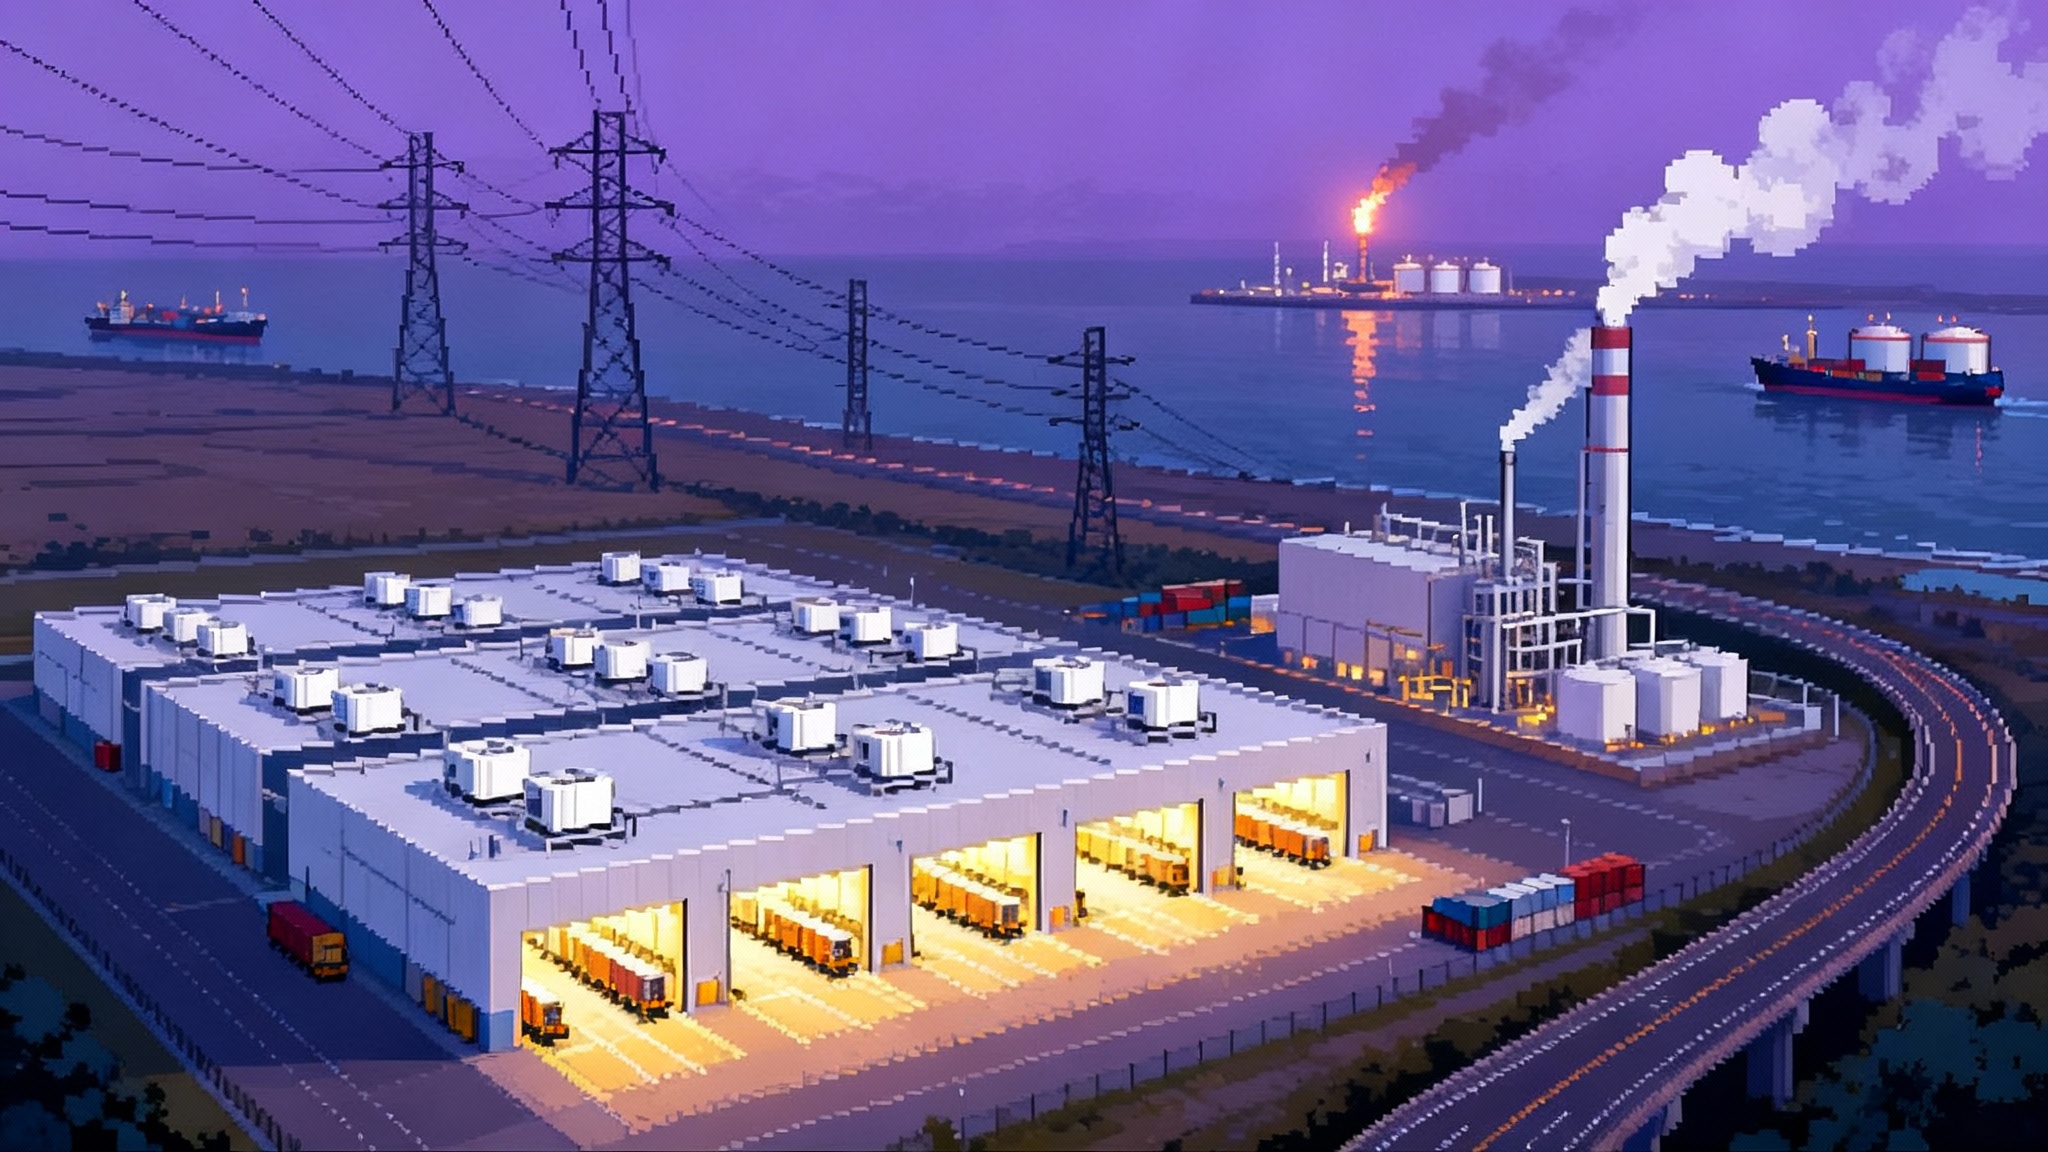
Shipping’s First Global Carbon Price Will Reshape Fuels
In April 2025 the IMO advanced a global carbon price paired with a fuel intensity standard that could upend refinery margins, LNG bunkering, and demand for green methanol and ammonia. Here is what changes by 2027 and who wins or loses.
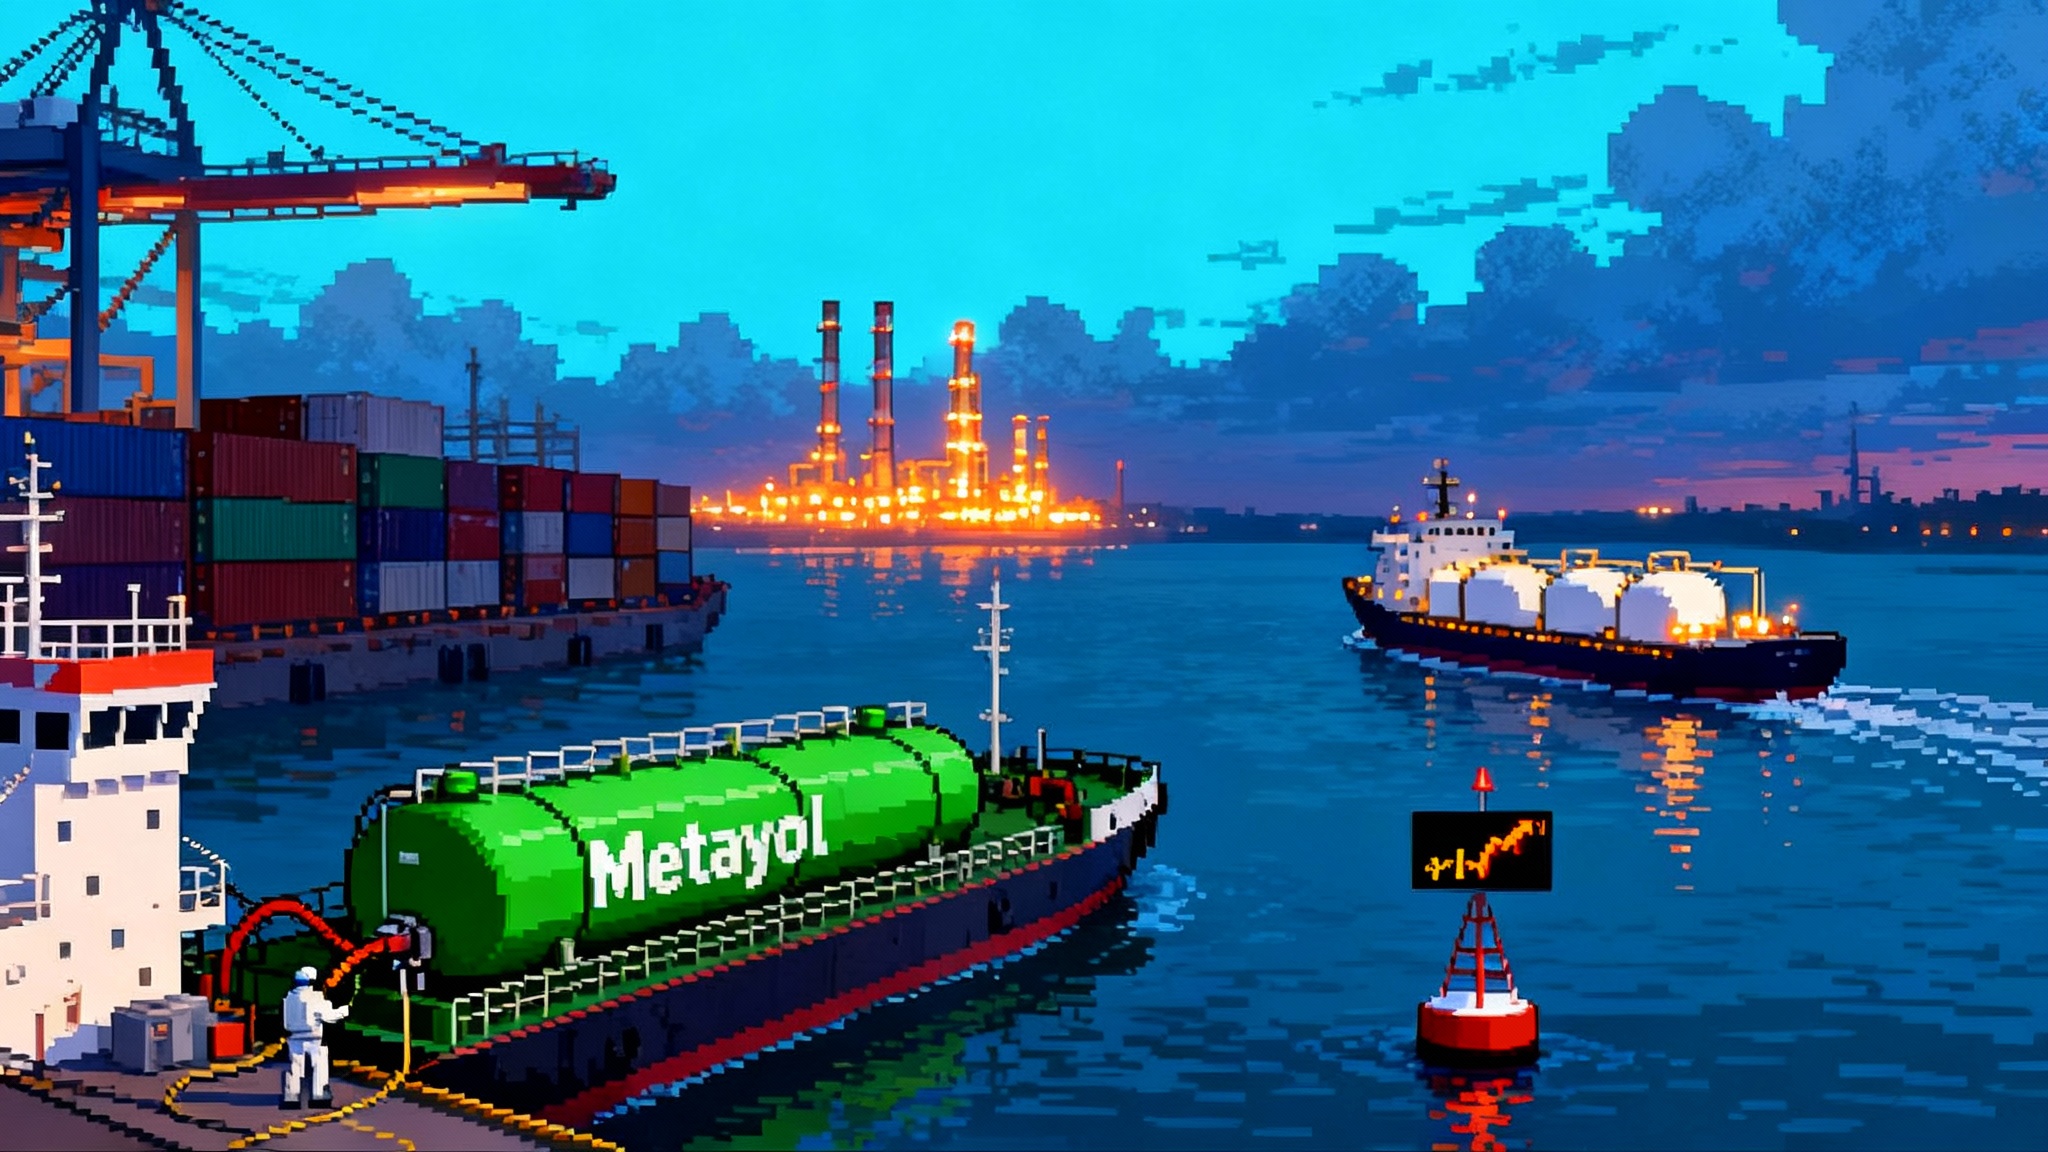
The moment global shipping got a carbon price
In April 2025 the International Maritime Organization’s Marine Environment Protection Committee approved the legal text for a Net-Zero Framework that pairs a worldwide emissions pricing mechanism with a marine fuel greenhouse-gas intensity standard. It is the first time a single global industry has been put on both limits and a price. The draft is due for adoption at an extraordinary session in October 2025 and, under MARPOL’s tacit acceptance procedure, is expected to enter into force about 16 months after adoption, which points to early 2027. For scope, compliance options, and timing, see the IMO MEPC 83 meeting summary.
What the Net-Zero Framework actually does
The package has two moving parts that work together:
- A global fuel standard. Ships must reduce the lifecycle GHG intensity of the energy they use, measured on a well-to-wake basis. It is goal-based rather than prescriptive, so operators can comply by switching fuels, blending low-carbon components, or improving energy efficiency.
- An economic measure. If a ship’s annual GHG intensity sits above the target, the company must balance the gap by acquiring units. Ships that beat the target can bank or transfer surplus units, and a Net-Zero Fund will issue remedial units in exchange for contributions. The mechanism creates a route for rewarding zero and near-zero fuel use.
The logic is simple. The standard creates a structural pull toward cleaner energy, while the price makes non-compliance progressively expensive.
Timelines that matter
- April 7 to 11, 2025: MEPC 83 approves the draft chapter for MARPOL Annex VI.
- October 2025: Formal adoption at an extraordinary MEPC session.
- Entry into force: roughly February 2027, using MARPOL’s 16-month timeline.
That leaves two trading years for industry to plan, contract fuels, and reprice charters.
How this hits bunker markets and refinery margins
The carbon price bites emissions, not sulfur. On a tank-to-wake basis, the CO2 per unit energy is similar for residual and distillate fossil fuels. What changes is the ability to comply with the intensity rule and the cost of doing so.
- HSFO with scrubbers. The scrubber spread stays, but the value of burning cheap HSFO narrows if you cannot find credible pathways to reduce lifecycle intensity. HSFO is hard to blend with bio-components at scale. Expect a wider HSFO discount versus VLSFO and MGO in ports where low-carbon blending credits command a premium. Scrubber economics remain positive on pure fuel price, but the carbon bill will erode part of that advantage.
- VLSFO. More flexible than HSFO for co-processing and certain drop-in blends. VLSFO could hold value in hubs that develop certified bio-component supply and robust chain-of-custody systems. Where blending is constrained, spreads to MGO will compress.
- MGO and MDO. Distillates become the compliance workhorse. They are easier to blend with hydrotreated vegetable oil and other bio-intermediates, and verification chains are better understood. Distillate cracks should strengthen in anticipatory trades, especially in Europe, Singapore, and the US Gulf where blending and verification capacity can scale fastest.
Refiners with hydroprocessing flexibility and biofeed access win on margin capture. Simple refineries heavy on residual output face weaker realizations unless they can swing into VLSFO barrels that serve as blendstock. Traders with storage and mass-balance expertise will arbitrage location and certificate value, creating a new premium for authenticated low-carbon megajoules.
LNG bunkering in the new regime
LNG’s role becomes more conditional. On a pure CO2 basis LNG helps, but on a full well-to-wake basis with methane and nitrous oxide included, benefits depend on methane slip control and upstream leakage. The intensity standard forces that accounting. For gas market context and Europe’s shifting demand, see U.S. LNG’s 2025 reboot and Europe.
Expect three paths:
- Conventional LNG gains only modest compliance value unless operators invest in methane abatement kits, optimized engines, and tight supply certification.
- Bio-LNG or e-LNG, if contractually verified, can create strong surplus units but will be supply limited and price sensitive to competing sectors.
- Long-term, LNG’s bunkering network remains a strategic asset because it can pivot to low-carbon gaseous fuels, yet asset owners must avoid being stranded by stricter methane accounting. Related policy shifts are reshaping contracts, as discussed in Methane fee repeal and markets.
Result: LNG stays relevant on specific routes and vessel classes, but it is no longer the default compliance hedge. It competes with methanol and, later, ammonia on a level defined by verified lifecycle data rather than a simple tailpipe view.
Green methanol and ammonia get clearer offtake signals
The world’s first global price on shipping emissions, combined with a declining intensity curve, gives producers something they have lacked: bankable demand. It does not eliminate cost gaps, but it stabilizes the policy environment for long-dated contracts.
- Green methanol. With hundreds of methanol dual-fuel vessels ordered or in the pipeline, the near-term bottleneck is fuel. The framework enables long-term offtake deals with price escalators indexed to unit prices, not only to fossil fuel spreads. Expect an early pull for bio-methanol and waste-based feedstocks, followed by e-methanol as electrolysis capacity scales.
- Ammonia. Engine technology is maturing and safety cases are advancing. Ammonia shines at high substitution rates where its zero carbon at the point of use can generate surplus units. The hurdle remains infrastructure and crew safety. Hydrogen and ammonia supply strategies intersect with incentives covered in Hydrogen’s 2025 reset and 45V.
For both fuels, credible certification and chain-of-custody systems are critical. The standard will reward molecules with verifiable low well-to-wake intensity. This tilts the field toward producers integrated with renewable power and CO2 of biogenic or direct air capture origin.
Compliance cost modeling you can use
Think in four steps:
- Estimate your activity emissions. A rule of thumb for fossil bunkers is around 3.1 tonnes CO2e per tonne of fuel on a well-to-wake basis, acknowledging variation by fuel and supply chain.
- Estimate your intensity gap. If your ship sits, for example, 10 percent above the annual target, then your emissions shortfall equals 10 percent of your activity emissions.
- Apply a unit price. The framework does not fix a dollar number, but it creates a market for remedial units and surplus units. Initial price discovery will be shaped by regional regimes and by supply of low-carbon megajoules.
- Decide whether to buy units or buy down intensity through fuel and technology.
Two stylized cases to illustrate the math:
- Asia to Europe container service. Assume a 14,000 TEU ship consumes 100 tonnes per day for 30 days between bunkers. Emissions are about 9,300 tCO2e for the voyage. With a 10 percent overshoot, the shortfall is 930 tCO2e. If remedial units price at 150 dollars per tonne, the compliance cost is about 140,000 dollars, or roughly 14 dollars per loaded TEU if 10,000 TEU are paying cargo.
- Long range product tanker. Assume 50 tonnes per day for 40 days for 2,000 tonnes of fuel. Emissions are about 6,200 tCO2e. With a 15 percent overshoot and a 200 dollar unit price, the compliance cost is about 186,000 dollars per voyage.
Now layer in abatement options:
- Blending 20 to 30 percent certified bio-component into MGO can shrink the intensity gap materially, though the cost per abated tonne will track biofeed markets.
- Switching a call to a port with reliable low-carbon fuel supply might save on unit purchases even after paying a freight detour.
- Speed and routing still matter. Operational measures that cut total energy demand reduce both your fuel bill and the number of units you need.
Price bands to plan against:
- 2027 to 2030: 50 to 150 dollars per tonne CO2e. Early supply of surplus units from first movers and Fund mechanisms are likely to cap prices, but there is upside if verification lags fuel adoption.
- 2030 to 2035: 100 to 250 dollars per tonne CO2e. As targets tighten, pricing should converge with carbon prices in major regions. A squeeze to 300 dollars is possible in a low-supply scenario.
These are planning bands, not forecasts. The spread you see in your lanes will depend on how quickly low-carbon fuel supply scales in the ports you actually use.
Ports and bunkering infrastructure build-outs
Ports will choose between two strategies:
- Certificate-rich hubs. Focus on verification, mass-balance systems, and book-and-claim capability that lets ships earn units even when molecules are not physically segregated. Distillate tanks, blending facilities, and lab capacity are the first investments.
- Molecule-first hubs. Add dedicated storage, safety systems, and transfer equipment for methanol and later ammonia. Expect 24 to 36 months for permits, safety cases, and construction for modest scale terminals. Large ammonia import facilities with bunkering capability will need longer lead times and community engagement.
Singapore, Northwest Europe, the US Gulf, and key Middle East hubs are best placed to do both. Secondary ports will likely partner with traders to offer book-and-claim services until local volumes justify tanks and pipes.
How it fits with EU ETS and FuelEU Maritime
Europe now runs two shipping climate policies that matter globally. The EU ETS prices emissions for voyages to and from EU ports and will ramp coverage over time. FuelEU Maritime sets a declining lifecycle intensity requirement for energy used on board ships calling at EU ports, starting with a 2 percent reduction in 2025 and reaching much deeper cuts by 2050. The European Commission’s summary is here: EU FuelEU Maritime overview.
Alignment and tension points to watch:
- Double pricing. A ship on an Asia to EU route could face EU ETS costs and an IMO remedial unit bill. Unless the IMO text or bilateral deals include crediting, operators will have to manage two carbon price exposures.
- Accounting rules. Both regimes count methane and nitrous oxide and use lifecycle logic, but methodologies and default factors may differ. Expect a premium for fuels with cross-regime certification.
- Revenue flows. The IMO Net-Zero Fund will recycle contributions. The EU channels ETS revenue through member states. That affects where abatement capital flows and who can claim rewards.
- Pooling and banking. FuelEU allows pooling of ships and budget banking and borrowing. The IMO design also includes banking and transfer of surplus units. Companies that master portfolio compliance can lower total cost.
Big picture, regional policies will anchor expectations for the global unit price, but the global standard prevents a race to the bottom by setting a floor on ambition outside regional waters.
Winners and losers in the next cycle
Winners
- Integrated energy majors that trade and refine. The ability to optimize molecules and certificates across hubs is an edge. Those already invested in bio-intermediates, co-processing, and e-fuel joint ventures will capture rising low-carbon premia.
- Ports that move early on verification and safety. The first credible bunkering corridors for methanol and then ammonia will attract fleet commitments and long-term throughput.
- Engine makers and yards with dual-fuel depth. The orderbook will favor platforms that can switch between fossil and green variants, preserving residual value.
- E-fuel developers with offtake plus certification. Projects tied to renewable power and transparent chain-of-custody can price units into contracts and reach financial close.
Losers
- Simple refineries centered on HSFO with limited upgrade capacity. Without access to biofeeds or co-processing, realizations lag and HSFO discounts widen.
- Owners who bet only on scrubbers. Fuel price spreads still pay, but the carbon cost erodes that edge as intensity targets tighten.
- LNG positions without methane solutions. Assets remain useful, but compliance value is capped without verified low-methane pathways.
- Traders without verification muscle. The new arbitrage is in certified intensity, not only geography and time.
Strategy for shipowners and charterers
- Build a unit price curve into your budgeting now. Use the 50 to 150 dollars band for 2027 to 2030 and 100 to 250 dollars for the early 2030s, then stress test at 300.
- Contract verified molecules, not only volume. Write chain-of-custody and recertification language into bunker contracts. Pay for audit readiness.
- Optimize ports and schedules. Choose call patterns that align with supply of low-intensity fuels and reliable verification.
- Upgrade for optionality. Consider retrofits that enable methanol use or higher bio-blend ratios. Evaluate methane abatement if you operate LNG tonnage.
- Align incentives in charters. Explicitly pass through unit costs and share rewards from surplus units to motivate operational savings.
The bottom line
The IMO has set the shipping energy transition on a new footing. A global intensity standard and a real price on emissions will not transform the bunker pool overnight. They will change relative economics in ways that compound with every voyage and every investment decision. Distillates gain a compliance premium. LNG becomes a choice that hinges on methane. Methanol and ammonia move from PowerPoint to ports. The traders who master molecules and mass balance win. The clock to 2027 is already ticking.



![Why Your UI Shows [object Object] and How to Fix It Fast](https://fvnmlvqcgqaarpyajaoh.supabase.co/storage/v1/object/public/images/1758580185084-c5pj4s.png)
